IHOP 2008 Annual Report Download - page 86
Download and view the complete annual report
Please find page 86 of the 2008 IHOP annual report below. You can navigate through the pages in the report by either clicking on the pages listed below, or by using the keyword search tool below to find specific information within the annual report.-
 1
1 -
2
-
3
-
4
-
5
-
6
-
7
-
8
-
9
-
10
-
11
-
12
-
13
-
14
-
15
-
16
-
17
-
18
-
19
-
20
-
21
-
22
-
23
-
24
-
25
-
26
-
27
-
28
-
29
-
30
-
31
-
32
-
33
-
34
-
35
-
36
-
37
-
38
-
39
-
40
-
41
-
42
-
43
-
44
-
45
-
46
-
47
-
48
-
49
-
50
-
51
-
52
-
53
-
54
-
55
-
56
-
57
-
58
-
59
-
60
-
61
-
62
-
63
-
64
-
65
-
66
-
67
-
68
-
69
-
70
-
71
-
72
-
73
-
74
-
75
-
 76
76 -
 77
77 -
 78
78 -
 79
79 -
 80
80 -
 81
81 -
 82
82 -
 83
83 -
 84
84 -
 85
85 -
 86
86 -
 87
87 -
 88
88 -
 89
89 -
 90
90 -
 91
91 -
 92
92 -
 93
93 -
 94
94 -
 95
95 -
 96
96 -
97
-
98
-
99
-
100
-
101
-
102
-
103
-
104
-
105
-
106
-
107
-
108
-
109
-
110
-
111
-
112
-
113
-
114
-
115
-
116
-
117
-
118
-
119
-
120
-
121
-
122
-
123
-
124
-
125
-
126
-
127
-
128
-
129
-
130
-
131
-
132
-
133
-
134
-
135
-
136
-
137
-
138
-
139
-
140
-
141
-
142
-
143
-
144
-
145
-
146
-
147
-
148
-
149
-
150
-
151
-
152
-
153
-
154
-
155
-
156
-
157
-
158
-
159
-
160
-
161
-
162
 |
 |

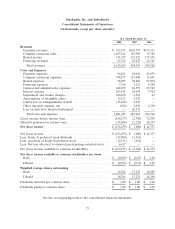
DineEquity, Inc. and Subsidiaries
Consolidated Balance Sheets
(In thousands, except share amounts)
December 31,
2008 2007
Assets
Current assets
Cash and cash equivalents ......................................... $ 114,443 $ 26,838
Restricted cash ................................................. 83,355 128,138
Short-term investments, at market value ................................ 276 300
Receivables, net ................................................ 117,930 115,335
Inventories .................................................... 10,959 13,280
Prepaid income taxes ............................................. 15,734 31,020
Prepaid expenses ................................................ 17,067 30,831
Deferred income taxes ............................................ 27,504 21,862
Assets held for sale .............................................. 11,861 66,074
Total current assets ............................................. 399,129 433,678
Non-current restricted cash .......................................... 53,395 57,962
Restricted assets related to captive insurance subsidiary ....................... 5,573 10,518
Long-term receivables .............................................. 277,106 288,452
Property and equipment, net ......................................... 824,482 1,139,616
Goodwill ....................................................... 697,470 730,728
Other intangible assets, net .......................................... 956,036 1,011,457
Other assets, net ................................................. 148,026 158,751
Total assets .................................................. $3,361,217 $3,831,162
Liabilities and Stockholders’ Equity
Current liabilities
Current maturities of long-term debt .................................. $ 15,000 $ —
Accounts payable ............................................... 48,983 99,019
Accrued employee compensation and benefits ............................ 44,299 56,795
Deferred revenue ............................................... 95,532 76,802
Accrued financing costs ........................................... 20,071 63,045
Other accrued expenses ........................................... 55,249 49,203
Deferred compensation ........................................... — 21,236
Accrued interest payable .......................................... 3,580 15,240
Total current liabilities .......................................... 282,714 381,340
Long-term debt, less current maturities .................................. 1,853,367 2,263,887
Financing obligations, less current maturities .............................. 318,651 —
Capital lease obligations, less current maturities ............................ 161,310 168,242
Deferred income taxes ............................................. 395,448 504,865
Other liabilities .................................................. 119,910 116,405
Commitments and contingencies
Preferred stock, Series A, $1 par value, 220,000 shares authorized; 190,000 shares issued
and outstanding ................................................ 187,050 187,050
Stockholders’ equity
Preferred stock, Series B, $1 par value, 10,000,000 shares authorized; 35,000 shares
issued and outstanding .......................................... 37,332 35,181
Common stock, $.01 par value, 40,000,000 shares authorized; 2008: 23,696,950 shares
issued and 17,466,355 shares outstanding; 2007: 23,359,664 shares issued and
17,105,469 shares outstanding ...................................... 237 230
Additional paid-in-capital ........................................... 165,315 149,564
Retained earnings ................................................. 145,810 338,790
Accumulated other comprehensive loss .................................. (29,408) (36,738)
Treasury stock, at cost (2008: 6,230,595 shares; 2007: 6,254,195 shares) ............. (276,519) (277,654)
Total stockholders’ equity .......................................... 42,767 209,373
Total liabilities and stockholders’ equity ................................ $3,361,217 $3,831,162
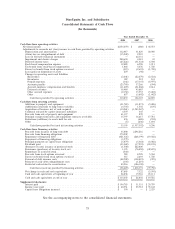
See the accompanying notes to the consolidated financial statements.
72