IHOP 2008 Annual Report Download - page 65
Download and view the complete annual report
Please find page 65 of the 2008 IHOP annual report below. You can navigate through the pages in the report by either clicking on the pages listed below, or by using the keyword search tool below to find specific information within the annual report.-
 1
1 -
2
-
3
-
4
-
5
-
6
-
7
-
8
-
9
-
10
-
11
-
12
-
13
-
14
-
15
-
16
-
17
-
18
-
19
-
20
-
21
-
22
-
23
-
24
-
25
-
26
-
27
-
28
-
29
-
30
-
31
-
32
-
33
-
34
-
35
-
36
-
37
-
38
-
39
-
40
-
41
-
42
-
43
-
44
-
45
-
46
-
47
-
48
-
49
-
50
-
51
-
52
-
53
-
54
-
 55
55 -
 56
56 -
 57
57 -
 58
58 -
 59
59 -
 60
60 -
 61
61 -
 62
62 -
 63
63 -
 64
64 -
 65
65 -
 66
66 -
 67
67 -
 68
68 -
 69
69 -
 70
70 -
 71
71 -
 72
72 -
 73
73 -
 74
74 -
 75
75 -
76
-
77
-
78
-
79
-
80
-
81
-
82
-
83
-
84
-
85
-
86
-
87
-
88
-
89
-
90
-
91
-
92
-
93
-
94
-
95
-
96
-
97
-
98
-
99
-
100
-
101
-
102
-
103
-
104
-
105
-
106
-
107
-
108
-
109
-
110
-
111
-
112
-
113
-
114
-
115
-
116
-
117
-
118
-
119
-
120
-
121
-
122
-
123
-
124
-
125
-
126
-
127
-
128
-
129
-
130
-
131
-
132
-
133
-
134
-
135
-
136
-
137
-
138
-
139
-
140
-
141
-
142
-
143
-
144
-
145
-
146
-
147
-
148
-
149
-
150
-
151
-
152
-
153
-
154
-
155
-
156
-
157
-
158
-
159
-
160
-
161
-
162
 |
 |
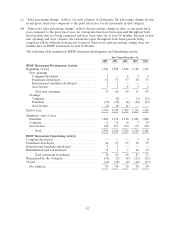
Company restaurant operations loss, which is income less expenses, for IHOP company restaurants
was $2.5 million in 2007, or 23.5% higher than the loss of $2.0 million in 2006. This is primarily due to
lower sales per restaurant as well as higher salary and benefits costs.
Rental Operations
Rental operations profit, which is rental income less rental expenses and exclusively IHOP,
decreased by $0.2 million or 0.5% in 2007, as compared to 2006. Rental operations profit in 2007
compared to 2006 was impacted by the write-off of deferred rent resulting from terminated subleases
on restaurants reacquired in 2006. Deferred rent on operating subleases is the difference between
straight-line rent and the actual amount received. Straight-line rent is the amount of rent over the full
lease term spread over equal monthly amounts.
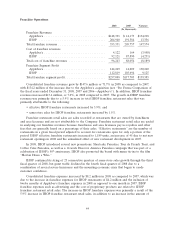
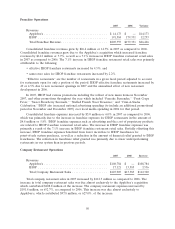
Financing Operations
Financing operations profit, which is financing revenues less financing expenses, is exclusively
attributable to the IHOP business unit. In 2007 financing operations profit decreased by $1.0 million or
5.1% compared to 2006. This decrease was primarily attributable to the decrease in franchise and
equipment note interest due to the expected reduction in franchise fee note balances. These decreases
were partially offset by an increase in net profit margin on the sale of franchises and equipment
associated with company-developed and rehabilitated and refranchised restaurants. In 2007, the
Company had a net profit margin of $0.1 million associated with four refranchised restaurants,
compared to a negative margin of $0.5 million associated with nine refranchised restaurants in 2006.
Loss on Derivative Financial Instrument
As further described under ‘‘Liquidity and Capital Resources,’’ we entered into a swap
arrangement in July 2007. Settlement of the swap resulted in additional interest expense related to the
designated portion of $62.1 million for 2007 and $1.2 million of interest expense related to the
amortization of other comprehensive loss related to the designated portion of the swap over the
expected life of the related debt, which is included in the accompanying Consolidated Statements of
Operations.
General and Administrative Expenses
General and administrative expenses increased by $18.1 million or 28.4% in 2007 compared to the
prior year, primarily due to one month of Applebee’s expenses in the amount of $12.3 million. General
and administrative expenses for IHOP as a percentage of total IHOP operating revenues increased
19.2% in 2007 compared to 18.2% in 2006, primarily due to increased professional services, and
increased expenses for equity based compensation. Professional services increased by $3.9 million in
2007 compared to 2006, primarily due to consulting fees related to the integration of Applebee’s.
Excluding the acquisition-related expenditures of $3.0 million, growth would have been 4.4%. Equity
based compensation expenses related to the issuance of additional restricted stock increased by
$1.6 million in 2007 compared to 2006. In addition, other compensation increased by $0.5 million
compared to 2006.
Interest Expense
Interest expense increased by $20.8 million in 2007 compared to 2006, primarily due to one month
of Applebee’s expenses in the amount of $14.6 million which is attributable to interest associated with
the securitization for the acquisition. Interest expense for IHOP increased by $6.1 million or 77.4% in
2007 compared to 2006 as a result of the higher level of debt associated with the securitizations.
51