IHOP 2008 Annual Report Download - page 28
Download and view the complete annual report
Please find page 28 of the 2008 IHOP annual report below. You can navigate through the pages in the report by either clicking on the pages listed below, or by using the keyword search tool below to find specific information within the annual report.-
 1
1 -
2
-
3
-
4
-
5
-
6
-
7
-
8
-
9
-
10
-
11
-
12
-
13
-
14
-
15
-
16
-
17
-
 18
18 -
 19
19 -
 20
20 -
 21
21 -
 22
22 -
 23
23 -
 24
24 -
 25
25 -
 26
26 -
 27
27 -
 28
28 -
 29
29 -
 30
30 -
 31
31 -
 32
32 -
 33
33 -
 34
34 -
 35
35 -
 36
36 -
 37
37 -
 38
38 -
39
-
40
-
41
-
42
-
43
-
44
-
45
-
46
-
47
-
48
-
49
-
50
-
51
-
52
-
53
-
54
-
55
-
56
-
57
-
58
-
59
-
60
-
61
-
62
-
63
-
64
-
65
-
66
-
67
-
68
-
69
-
70
-
71
-
72
-
73
-
74
-
75
-
76
-
77
-
78
-
79
-
80
-
81
-
82
-
83
-
84
-
85
-
86
-
87
-
88
-
89
-
90
-
91
-
92
-
93
-
94
-
95
-
96
-
97
-
98
-
99
-
100
-
101
-
102
-
103
-
104
-
105
-
106
-
107
-
108
-
109
-
110
-
111
-
112
-
113
-
114
-
115
-
116
-
117
-
118
-
119
-
120
-
121
-
122
-
123
-
124
-
125
-
126
-
127
-
128
-
129
-
130
-
131
-
132
-
133
-
134
-
135
-
136
-
137
-
138
-
139
-
140
-
141
-
142
-
143
-
144
-
145
-
146
-
147
-
148
-
149
-
150
-
151
-
152
-
153
-
154
-
155
-
156
-
157
-
158
-
159
-
160
-
161
-
162
 |
 |

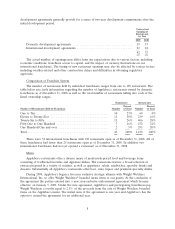
syndication and cable media. For 2007 and 2008 the franchisees agreed to reallocate one half of their
local advertising fees to national media spending and for 2009 the franchisees agreed to reallocate 62%
of their local advertising fees. As a result, more of our television advertising will be seen on national
broadcast, syndication and cable media. This should result in a significant increase in the number of
people who view our commercials and the frequency with which they see them.
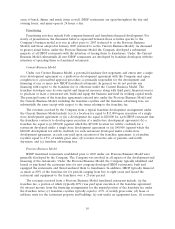
Purchasing
IHOP has entered into supply contracts for pancake and waffle dry-mixes and pricing agreements
for most major products carried in IHOP restaurants to ensure the availability of quality products at
competitive prices. IHOP has negotiated other agreements or arrangements with food distribution
companies to limit markups charged on food and restaurant supplies purchased by individual IHOP
restaurants. In some instances, IHOP is required to enter into commitments to purchase food and
other items on behalf of the IHOP system as a whole for the purpose of supplying limited time
promotions. At December 31, 2008, there were outstanding purchase commitments to purchase food
items of approximately $4.2 million. We have developed processes to facilitate the liquidation of any
such commitments to minimize financial exposure. To take advantage of economies associated with
system-wide volume purchasing, we and our franchisees have developed procurement processes to
secure favorable pricing agreements based on system wide ordering. These agreements ensure
availability of most major products carried in IHOP restaurants. In February 2009, we announced the
formation of CSCS, an independent purchasing co-operative to manage procurement activities for the
Applebee’s and IHOP restaurants choosing to join the co-operative.
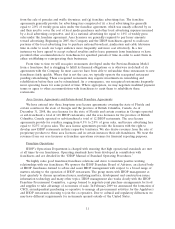
Industry Overview and Competition
The Applebee’s and IHOP restaurant chains are among the numerous restaurant chains
participating in the $500 billion plus consumer food service market in the United States. The restaurant
business is generally categorized into segments by price point ranges, the types of food and beverages
offered and the types of service experience. These segments include, among others, fast food or quick
service restaurants (‘‘QSR’’), family dining, casual dining and fine dining. Each of these segments can
be broken down further into the type of food served by the restaurant. For example, the QSR category
includes sandwich chains, hamburger chains, and other such chains.
Applebee’s competes in the casual dining segment against national and multi-state operators such
as Chili’s, T.G.I. Friday’s and Ruby Tuesday, among others. In addition, there are many independent
restaurants across the country in the casual dining segment. Casual dining restaurants offer full table
service and typically have bars or serve liquor, wine and beer. Applebee’s is one of the largest casual
dining brands in the world, in terms of number of restaurants and market share.
IHOP competes in the family dining segment against national and multi-state operators such as
Denny’s, Cracker Barrel Old Country Store, Bob Evans Restaurants and Perkins Restaurant and
Bakery. In addition, there are many independent restaurants and diners across the country in the family
dining segment. Family dining restaurants offer full table service, typically do not have bars or serve
liquor, and usually offer breakfast in addition to lunch and dinner items. IHOP is one of the largest
family dining brands in the world, in terms of number of restaurants and market share.
The restaurant business is highly competitive and is affected by, among other things, economic
conditions, price levels, on-going changes in eating habits and food preferences, population trends and
traffic patterns. The principal bases of competition in the industry are the type, quality and price of the
food products served. Additionally, restaurant location, quality and speed of service, advertising, name
identification and attractiveness of facilities are important.
14