HTC 2015 Annual Report Download - page 97
Download and view the complete annual report
Please find page 97 of the 2015 HTC annual report below. You can navigate through the pages in the report by either clicking on the pages listed below, or by using the keyword search tool below to find specific information within the annual report.-
 1
1 -
2
-
3
-
4
-
5
-
6
-
7
-
8
-
9
-
10
-
11
-
12
-
13
-
14
-
15
-
16
-
17
-
18
-
19
-
20
-
21
-
22
-
23
-
24
-
25
-
26
-
27
-
28
-
29
-
30
-
31
-
32
-
33
-
34
-
35
-
36
-
37
-
38
-
39
-
40
-
41
-
42
-
43
-
44
-
45
-
46
-
47
-
48
-
49
-
50
-
51
-
52
-
53
-
54
-
55
-
56
-
57
-
58
-
59
-
60
-
61
-
62
-
63
-
64
-
65
-
66
-
67
-
68
-
69
-
70
-
71
-
72
-
73
-
74
-
75
-
76
-
77
-
78
-
79
-
80
-
81
-
82
-
83
-
84
-
85
-
86
-
 87
87 -
 88
88 -
 89
89 -
 90
90 -
 91
91 -
 92
92 -
 93
93 -
 94
94 -
 95
95 -
 96
96 -
 97
97 -
 98
98 -
 99
99 -
 100
100 -
 101
101 -
 102
102 -
 103
103 -
 104
104 -
 105
105 -
 106
106 -
 107
107 -
108
-
109
-
110
-
111
-
112
-
113
-
114
-
115
-
116
-
117
-
118
-
119
-
120
-
121
-
122
-
123
-
124
-
125
-
126
-
127
-
128
-
129
-
130
-
131
-
132
-
133
-
134
-
135
-
136
-
137
-
138
-
139
-
140
-
141
-
142
-
143
-
144
-
145
-
146
-
147
-
148
-
149
 |
 |

Financial information
Financial information
190
191
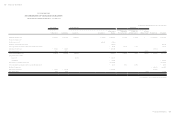
2015 2014
CASH FLOWS FROM INVESTING ACTIVITIES
Proceeds from disposal of financial assets measured at cost $ 327 $ -
Proceeds from capital reduction of investments accounted for using equity method - 2,007,655
Payments for property, plant and equipment ( 385,477) ( 794,925)
Increase in refundable deposits ( 1,318,594) -
Decrease in refundable deposits - 6,097
Payments for intangible assets ( 81,970) ( 221,717)
Decrease in other current financial assets - 2,359,041
Dividend received 38,362 7,687
Net cash (used in) generated from investing activities ( 1,747,352) 3,363,838
CASH FLOWS FROM FINANCING ACTIVITIES
Payments for treasury shares ( 200,955) -
Increase in guarantee deposits received 474 -
Net cash outflow on acquisition of subsidiaries ( 579,172) ( 383,591)
Dividends paid to owners of the Company ( 314,636) -
Net cash used in financing activities ( 1,094,289) ( 383,591)
NET (DECREASE) INCREASE IN CASH AND CASH EQUIVALENTS ( 15,916,802) 3,571,286
CASH AND CASH EQUIVALENTS, BEGINNING OF THE YEAR 36,605,790 33,034,504
CASH AND CASH EQUIVALENTS, END OF THE YEAR $ 20,688,988 $ 36,605,790
The accompanying notes are an integral part of the financial statements.(Concluded)
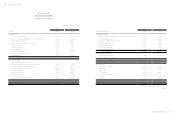
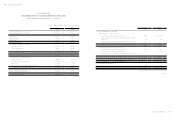
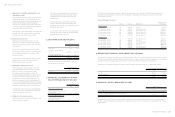
HTC CORPORATION
STATEMENTS OF CASH FLOWS
FOR THE YEARS ENDED DECEMBER 31, 2015 AND 2014
(In Thousands of New Taiwan Dollars)
2015 2014
CASH FLOWS FROM OPERATING ACTIVITIES
(Loss) profit before income tax $(16,781,544) $ 1,531,215
Adjustments for:
Depreciation expense 1,579,960 1,774,782
Amortization expense 682,553 649,887
Finance costs 7,819 16,485
Interest income ( 179,328) ( 214,092)
Compensation costs of employee share-based payments 513,002 244,346
Share of the profit or loss of subsidiaries and joint ventures 1,369,062 ( 587,645)
Loss on disposal of property, plant and equipment 33 -
Transfer of property, plant and equipment to expenses 8,339 -
Gain on sale of investments ( 327) -
Impairment losses on non-financial assets 3,943,192 731,833
Unrealized gains on sales 1,178,011 955,021
Realized gains on sales ( 955,021) ( 1,611,132)
Changes in operating assets and liabilities
Decrease (increase) in financial instruments held for trading 181,171 ( 77,823)
Decrease in trade receivables 6,394,021 1,561,578
Decrease (increase) in trade receivables - related parties 8,294,882 ( 3,046,657)
Decrease in other receivables 59,348 1,533,217
(Increase) decrease in inventories ( 3,554,159) 3,475,767
Decrease (increase) in prepayments 1,253,557 ( 1,033,973)
Decrease in other current assets 40,655 29,873
Decrease in other non-current assets 2,551,946 1,572,293
Decrease in note and trade payables ( 11,161,265) ( 1,972,913)
(Decrease) increase in trade payable - related parties ( 6,123,607) 886,502
Decrease in other payables ( 5,079,584) ( 4,163,252)
Increase (decrease) in provisions 9,427 ( 1,782,257)
Increase (decrease) in other current liabilities 2,508,568 ( 23,674)
Cash (used in) generated from operations (13,259,289) 449,381
Interest received 186,907 212,844
Interest paid ( 7,819) ( 16,485)
Income tax refund (paid) 5,040 ( 54,701)
Net cash (used in) generated from operating activities ( 13,075,161) 591,039
(Continued)