HTC 2015 Annual Report Download - page 122
Download and view the complete annual report
Please find page 122 of the 2015 HTC annual report below. You can navigate through the pages in the report by either clicking on the pages listed below, or by using the keyword search tool below to find specific information within the annual report.-
 1
1 -
2
-
3
-
4
-
5
-
6
-
7
-
8
-
9
-
10
-
11
-
12
-
13
-
14
-
15
-
16
-
17
-
18
-
19
-
20
-
21
-
22
-
23
-
24
-
25
-
26
-
27
-
28
-
29
-
30
-
31
-
32
-
33
-
34
-
35
-
36
-
37
-
38
-
39
-
40
-
41
-
42
-
43
-
44
-
45
-
46
-
47
-
48
-
49
-
50
-
51
-
52
-
53
-
54
-
55
-
56
-
57
-
58
-
59
-
60
-
61
-
62
-
63
-
64
-
65
-
66
-
67
-
68
-
69
-
70
-
71
-
72
-
73
-
74
-
75
-
76
-
77
-
78
-
79
-
80
-
81
-
82
-
83
-
84
-
85
-
86
-
87
-
88
-
89
-
90
-
91
-
92
-
93
-
94
-
95
-
96
-
97
-
98
-
99
-
100
-
101
-
102
-
103
-
104
-
105
-
106
-
107
-
108
-
109
-
110
-
111
-
 112
112 -
 113
113 -
 114
114 -
 115
115 -
 116
116 -
 117
117 -
 118
118 -
 119
119 -
 120
120 -
 121
121 -
 122
122 -
 123
123 -
 124
124 -
 125
125 -
 126
126 -
 127
127 -
 128
128 -
 129
129 -
 130
130 -
 131
131 -
 132
132 -
133
-
134
-
135
-
136
-
137
-
138
-
139
-
140
-
141
-
142
-
143
-
144
-
145
-
146
-
147
-
148
-
149
 |
 |

Financial information
Financial information
240
241
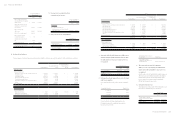
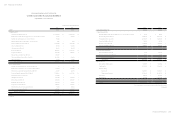
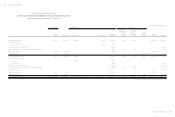
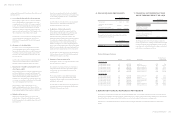
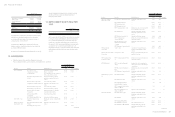
HTC CORPORATION AND SUBSIDIARIES
CONSOLIDATED STATEMENTS OF CASH FLOWS
FOR THE YEARS ENDED DECEMBER 31, 2015 AND 2014
(In Thousands of New Taiwan Dollars)
2015 2014
CASH FLOWS FROM OPERATING ACTIVITIES
(Loss) profit before income tax $( 15,581,540) $ 1,983,426
Adjustments for:
Depreciation expense 2,539,046 2,952,892
Amortization expense 1,956,533 1,868,817
Impairment losses recognized on trade receivables - 3,875
Finance costs 8,123 16,983
Interest income ( 419,969) ( 403,155)
Dividend income ( 352,074) ( 26,381)
Compensation costs of employee share - based payments 550,688 269,013
Share of the loss of associates and joint ventures 11,648 8,679
(Gain) loss on disposal of property, plant and equipment ( 8,385) 153,493
Transfer of property, plant and equipment to expenses 8,339 -
Gains on sale of investments ( 327) ( 157,995)
Impairment loss recognized on financial assets measured at cost - 373,257
Impairment losses on non-financial assets 4,859,336 695,945
Changes in operating assets and liabilities
Decrease (increase) in financial instruments held for trading 181,171 ( 77,823)
Decrease (increase) in trade receivables 10,621,336 ( 5,772,987)
Decrease in other receivables 112,713 1,552,870
(Increase) decrease in inventories ( 3,850,023) 5,864,806
Decrease (increase) in prepayments 2,225,138 ( 822,362)
Decrease in other current assets 4,658 25,539
Decrease in other non-current assets 2,666,129 1,779,567
Decrease in note and trade payables (14,204,958) ( 2,472,508)
Decrease in other payables ( 7,108,608) ( 5,279,307)
Increase (decrease) in provisions 151,079 ( 2,367,706)
Increase in other current liabilities 2,546,629 187,007
Cash (used in) generated from operations ( 13,083,318) 355,945
Interest received 334,309 311,262
Interest paid ( 8,123) ( 16,983)
Income tax paid (295,351) ( 990,083)
Net cash used in operating activities ( 13,052,483) ( 339,859)
(Continued)
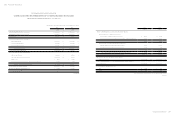
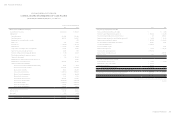
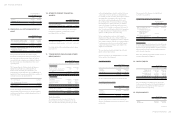
2015 2014
CASH FLOWS FROM INVESTING ACTIVITIES
Purchase of debt investments with no active market $ - $ ( 7,918)
Payments to acquire financial assets measured at cost ( 700,245) ( 432,463)
Proceeds from disposal of financial assets measured at cost 327 2,358,135
Payments to acquire investments accounted for using equity method ( 16,531) ( 15,836)
Payments for property, plant and equipment ( 987,329) ( 1,372,934)
Proceeds from disposal of property, plant and equipment 345,464 16,017
Increase in refundable deposits ( 1,317,602) -
Decrease in refundable deposits - 90,154
Payments for intangible assets ( 93,683) ( 244,588)
Increase in other current financial assets ( 3,765,336) -
Decrease in other current financial assets - 2,436,069
Dividend received 38,166 26,381
Net cash (used in) generated from investing activities ( 6,496,769) 2,853,017
CASH FLOWS FROM FINANCING ACTIVITIES
Refund of guarantee deposits received ( 13,071) ( 213,185)
Dividends paid to owners of the company ( 314,636) -
Buy-back of treasury shares ( 200,955) -
Net cash used in financing activities ( 528,662) ( 213,185)
EFFECT OF EXCHANGE RATE CHANGES ON CASH AND CASH EQUIVALENTS ( 318,845) 144,644
NET (DECREASE) INCREASE IN CASH AND CASH EQUIVALENTS ( 20,396,759) 2,444,617
CASH AND CASH EQUIVALENTS, BEGINNING OF THE YEAR 55,743,558 53,298,941
CASH AND CASH EQUIVALENTS, END OF THE YEAR $ 35,346,799 $ 55,743,558
The accompanying notes are an integral part of the consolidated financial statements.
(Concluded)