HTC 2015 Annual Report Download - page 115
Download and view the complete annual report
Please find page 115 of the 2015 HTC annual report below. You can navigate through the pages in the report by either clicking on the pages listed below, or by using the keyword search tool below to find specific information within the annual report.-
 1
1 -
2
-
3
-
4
-
5
-
6
-
7
-
8
-
9
-
10
-
11
-
12
-
13
-
14
-
15
-
16
-
17
-
18
-
19
-
20
-
21
-
22
-
23
-
24
-
25
-
26
-
27
-
28
-
29
-
30
-
31
-
32
-
33
-
34
-
35
-
36
-
37
-
38
-
39
-
40
-
41
-
42
-
43
-
44
-
45
-
46
-
47
-
48
-
49
-
50
-
51
-
52
-
53
-
54
-
55
-
56
-
57
-
58
-
59
-
60
-
61
-
62
-
63
-
64
-
65
-
66
-
67
-
68
-
69
-
70
-
71
-
72
-
73
-
74
-
75
-
76
-
77
-
78
-
79
-
80
-
81
-
82
-
83
-
84
-
85
-
86
-
87
-
88
-
89
-
90
-
91
-
92
-
93
-
94
-
95
-
96
-
97
-
98
-
99
-
100
-
101
-
102
-
103
-
104
-
 105
105 -
 106
106 -
 107
107 -
 108
108 -
 109
109 -
 110
110 -
 111
111 -
 112
112 -
 113
113 -
 114
114 -
 115
115 -
 116
116 -
 117
117 -
 118
118 -
 119
119 -
 120
120 -
 121
121 -
 122
122 -
 123
123 -
 124
124 -
 125
125 -
126
-
127
-
128
-
129
-
130
-
131
-
132
-
133
-
134
-
135
-
136
-
137
-
138
-
139
-
140
-
141
-
142
-
143
-
144
-
145
-
146
-
147
-
148
-
149
 |
 |

Financial information
Financial information
226
227
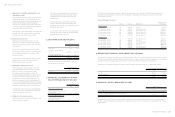
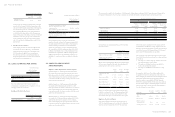
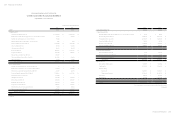
Compensation Cost of Share-based Payment
Arrangements
Compensation cost of share-based payment arrangement
recognized were NT$513,002 thousand and NT$244,346
thousand for the years ended December 31, 2015 and 2014,
respectively.
27. CAPITAL RISK MANAGEMENT
The Company manages its capital to ensure its ability to
continue as a going concern while maximizing the returns to
shareholders. The Company periodically reviews its capital
structure by taking into consideration macroeconomic
conditions, prevailing interest rate, and adequacy of cash
flows generated from operations; as the situation would
allow, the Company pays dividends, issues new shares,
repurchases shares, issues new debt, and redeems debt.
The Company is not subject to any externally imposed
capital requirements.
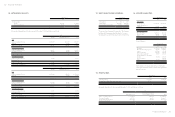
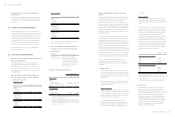
28. FINANCIAL INSTRUMENTS
Fair Value of Financial Instruments That Are Not
Measured at Fair Value
Financial instruments not carried at fair value held by
the Company include financial assets measured at cost.
The management considers that the carrying amounts of
financial assets and financial liabilities not carried at fair
value approximate their fair value or the fair value are not
measured reliably.
Fair Value of Financial Instruments That Are
Measured at Fair Value on a Recurring Basis
a. Fair value hierarchy
December 31, 2015
Level 1 Level 2 Level 3 Total
Financial assets at
FVTPL
Derivative
financial
instruments $ - $95,493 $ - $95,493
Available-for-sale
financial assets
Domestic listed
stocks - equity
investments $75 $ - $ - $ 75
Financial liabilities
at FVTPL
Derivative
financial
instruments $ - $36,544 $ - $36,544
December 31, 2014
Level 1 Level 2 Level 3 Total
Financial assets at
FVTPL
Derivative
financial
instruments $ - $262,544 $ - $262,544
Available-for-sale
financial assets
Domestic listed
stocks - equity
investments $93 $ - $ - $ 93
Financial liabilities
at FVTPL
Derivative
financial
instruments $ - $ 22,424 $ - $ 22,424
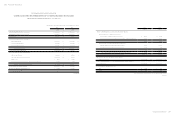
There were no transfers between Level 1 and 2 for the
years ended December 31, 2015 and 2014.
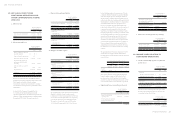
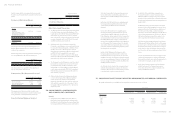
b. Valuation techniques and inputs applied for
the purpose of measuring Level 2 fair value
measurement
Financial
Instruments Valuation Techniques and Inputs
Derivatives - foreign
currency contracts
Discounted cash flow: Future
cash flows are estimated based on
observable forward exchange rates at
the end of the reporting period and
contract forward rates, discounted at
a rate that reflects the credit risk of
various counterparties.
Categories of Financial Instruments
December 31
2015 2014
Financial assets
FVTPL
Held for trading
Loans and receivables (Note 1)
Available-for-sale financial assets
(Note 2)
$ 95,493
36,300,441
515,936
$ 262,544
65,654,479
515,954
Financial liabilities
FVTPL
Held for trading
Amortized cost (Note 3)
36,544
54,404,412
22,424
76,705,116
Note 1: The balances included loans and receivables measured at amortized
cost, which comprise cash and cash equivalents, trade receivables, other
receivables and refundable deposits.
Note 2: The balances included available-for-sale financial assets and the
carrying amount of available-for-sale financial assets measured at cost.
Note 3: The balances included financial liabilities measured at amortized cost,
which comprise note and trade payables, other payables, agency receipts
and guarantee deposits received.
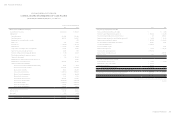
Financial Risk Management Objectives and
Policies
The Company's financial instruments mainly include equity
and debt investments, trade receivables, other receivables,
trade payables and other payables. The Company's
Corporate Treasury function provides services to the
business, coordinates access to domestic and international
financial markets, monitors and manages the financial risks
relating to the operations of the Company through internal
risk reports which analyze the exposures by degree and
magnitude of risks. These risks include market risk, credit
risk and liquidity risk.
The Company sought to minimize the effects of these risks
by using derivative financial instruments and non-derivative
financial instruments to hedge risk exposures. The use of
financial derivatives was governed by the Company's policies
approved by the board of directors, which provide written
principles on foreign exchange risk, interest rate risk, credit
risk, the use of financial derivatives and non-derivative
financial instruments, and the investment of excess liquidity.
Compliance with policies and exposure limits was reviewed
by the internal auditors on a continuous basis. The Company
did not enter into or trade financial instruments, including
derivative financial instruments, for speculative purposes.
The Corporate Treasury function reports quarterly to
the Company's supervisory and board of directors for
monitoring risks and policies implemented to mitigate risk
exposures.
a. Market risk
The Company's activities exposed it primarily to the
financial risks of changes in foreign currency exchange
rates. The Company entered into a variety of derivative
financial instruments to manage its exposure to foreign
currency risk.
There had been no change to the Company's exposure
to market risks or the manner in which these risks were
managed and measured.
Foreign currency risk
The Company undertook transactions denominated in
foreign currencies; consequently, exposures to exchange
rate fluctuations arose. Exchange rate exposures were
managed within approved policy parameters utilizing
forward foreign exchange contracts.
The carrying amounts of the Company's foreign
currency denominated monetary assets and monetary
liabilities and of the derivatives exposing to foreign
currency risk at the end of the reporting period are set
out in Note 31.
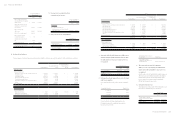
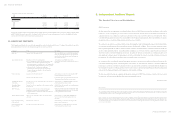
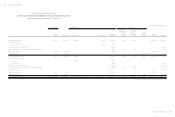
Sensitivity analysis
The Company was mainly exposed to the currency
United Stated dollars (“USD”), currency Euro (“EUR”),
currency Renminbi (“RMB”) and currency Japanese yen
(“JPY”).
The following table details the Company's sensitivity to
a 1% increase and decrease in the New Taiwan dollars
(“NTD”, the functional currency) against the relevant
foreign currencies. The sensitivity analysis included
only outstanding foreign currency denominated
monetary items and foreign currency forward contracts
designated as cash flow hedges. A positive number
below indicates an increase in pre-tax profit (loss) or
equity associated with the NTD strengthens 1% against
the relevant currency. For a 1% weakening of the NTD
against the relevant currency, there would be an equal
and opposite impact on pre-tax profit (loss) or equity,
and the balances below would be negative.
Profit or
Loss (1)
Equity
(2)
For the year ended December 31, 2015
USD
EUR
RMB
JPY
$( 17,990)
( 7,488)
(24,568)
( 932)
$ -
-
-
-
For the year ended December 31, 2014
USD
EUR
RMB
JPY
40,670
( 9,028)
( 35,725)
2,324
-
-
-
-
1)This was mainly attributable to the exposure outstanding on each
currency receivables and payables, which were not hedged at the end of
the reporting period.
2)This was mainly as a result of the changes in fair value of derivative
instruments designated as hedging instruments in cash flow hedges.
b. Credit risk
Credit risk refers to the risk that counterparty will
default on its contractual obligations resulting in
financial loss to the Company. As at the end of reporting
period, the Company's maximum exposure to credit risk
which will cause a financial loss to the Company due
to failure of counterparties to discharge an obligation
and financial guarantees provided by the Company
could arise from the carrying amount of the respective
recognized financial assets as stated in the balance
sheets. The Company does not issue any financial
guarantee involving credit risk.