HTC 2015 Annual Report Download - page 139
Download and view the complete annual report
Please find page 139 of the 2015 HTC annual report below. You can navigate through the pages in the report by either clicking on the pages listed below, or by using the keyword search tool below to find specific information within the annual report.-
 1
1 -
2
-
3
-
4
-
5
-
6
-
7
-
8
-
9
-
10
-
11
-
12
-
13
-
14
-
15
-
16
-
17
-
18
-
19
-
20
-
21
-
22
-
23
-
24
-
25
-
26
-
27
-
28
-
29
-
30
-
31
-
32
-
33
-
34
-
35
-
36
-
37
-
38
-
39
-
40
-
41
-
42
-
43
-
44
-
45
-
46
-
47
-
48
-
49
-
50
-
51
-
52
-
53
-
54
-
55
-
56
-
57
-
58
-
59
-
60
-
61
-
62
-
63
-
64
-
65
-
66
-
67
-
68
-
69
-
70
-
71
-
72
-
73
-
74
-
75
-
76
-
77
-
78
-
79
-
80
-
81
-
82
-
83
-
84
-
85
-
86
-
87
-
88
-
89
-
90
-
91
-
92
-
93
-
94
-
95
-
96
-
97
-
98
-
99
-
100
-
101
-
102
-
103
-
104
-
105
-
106
-
107
-
108
-
109
-
110
-
111
-
112
-
113
-
114
-
115
-
116
-
117
-
118
-
119
-
120
-
121
-
122
-
123
-
124
-
125
-
126
-
127
-
128
-
 129
129 -
 130
130 -
 131
131 -
 132
132 -
 133
133 -
 134
134 -
 135
135 -
 136
136 -
 137
137 -
 138
138 -
 139
139 -
 140
140 -
 141
141 -
 142
142 -
 143
143 -
 144
144 -
 145
145 -
 146
146 -
 147
147 -
 148
148 -
 149
149
 |
 |

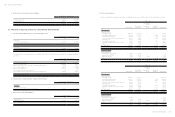
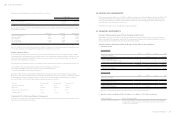
Financial information
Financial information
274
275
For the Year Ended December 31
2015 2014
$ 419,969 $403,155
Dividends
Others
352,074
155,993
26,381
404,588
$928,036 $834,124
(Concluded)
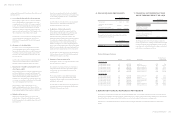
b. Other gains and losses
For the Year Ended December 31
2015 2014
Net gain (loss) on disposal of property, plant and equipment
Gains on disposal of investments
Net foreign exchange gains
Net gains arising on financial instruments classified as held for trading
Ineffective portion of cash flow hedge
Impairment losses
Other losses
$ 8,385
327
629,074
58,949
1,258
( 2,919,890)
(64,762)
$(153,493)
157,995
855,412
240,120
1,939
(547,510)
( 48,269)
$(2,286,659) $ 506,194
Gain or loss on financial assets and liabilities held for trading was derived from forward exchange transactions. The Company
entered into forward exchange transactions to manage exposures related to exchange rate fluctuations of foreign currency
denominated assets and liabilities.
In June 2015, the Company determined that the recoverable amount of partial prepayments and operation equipment were
less than its carrying amount, and thus recognized an impairment loss of NT$2,395,643 thousand and NT$524,247 thousand,
respectively.
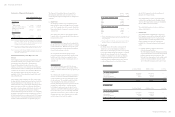
c. Impairment losses on financial assets
For the Year Ended December 31
2015 2014
Trade receivables (included in operating expenses)
Financial assets measured at cost (included in other gains and losses)
$ -
-
$ 3,875
373,257
$ - $ 377,132
d. Depreciation and amortization
For the Year Ended December 31
2015 2014
Property, plant and equipment
Investment properties
Intangible assets
$ 2,525,191
13,855
1,956,533
$2,952,892
-
1,868,817
$4,495,579 $ 4,821,709
An analysis of depreciation - by function
Operating costs
Operating expenses
Other losses
$ 1,339,250
1,185,941
13,855
$ 1,610,472
1,342,420
-
$2,539,046 $2,952,892
An analysis of amortization - by function
Operating costs
Operating expenses
$ 6,988
1,949,545
$ 19,788
1,849,029
$1,956,533 $ 1,868,817
e. Employee benefits expense
For the Year Ended December 31
2015 2014
Short-term benefits $14,601,086 $16,422,150
Post-employment benefits (Note 23)
Defined contribution plans
Defined benefit plans
623,742
5,595
787,960
6,591
629,337 794,551
Share-based payments (Note 29)
Equity-settled share-based payments 550,688 269,013
Total employee benefits expense $ 15,781,111 $ 17,485,714
An analysis of employee benefits expense- by function
Operating costs
Operating expenses
$ 3,738,378
12,042,733
$ 5,771,740
11,713,974
$ 15,781,111 $ 17,485,714
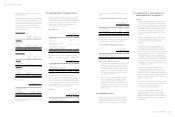
The existing Articles of Incorporation of HTC stipulate to distribute bonus to employees and remuneration to directors and
supervisors at the rates no less than 5% and no higher than 0.3%, respectively, of net income (net of the bonus and remuneration).
The employee bonus for the year ended December 31, 2014 should be appropriated at 5% of net income before deducting employee
bonus expenses. To be in compliance with the Company Act as amended in May 2015, the Company expects to modify the Articles
of Incorporation according to laws and regulations above on the board of directors' meeting on February 29, 2016, which stipulate
to distribute employees' compensation and remuneration to directors and supervisors at the rates no less than 4% and no higher
than 0.25%, respectively, of net profit before income tax, employees' compensation, and remuneration to directors and supervisors.
No employee bonus was estimated as the Company reported net loss for the year ended December 31, 2015. Material differences
between such estimated amounts and the amounts proposed by the board of directors on or before the date the annual consolidated
financial statements are authorized for issue are adjusted in the year the bonus and remuneration were recognized. If there is a
change in the proposed amounts after the annual consolidated financial statements were authorized for issue, the differences are
recorded as a change in accounting estimate.
The appropriations of bonuses to employees for 2014 and 2013 have been approved in the shareholders' meetings on June 2, 2015
and June 19, 2014, respectively, were as follows:
For the Year Ended December 31
2014 2013
Cash Dividends Share Dividends Cash Dividends Share Dividends
Bonus to employees $88,334 $ - $ - $ -
There was no difference between the amounts of the bonus to employees approved in the shareholders' meetings on June 2,
2015 and June 19, 2014 and the amounts recognized in the financial statements for the years ended December 31, 2014 and 2013,
respectively.
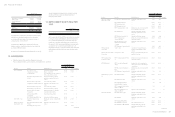
f. Impairment losses on non-financial assets
For the Year Ended December 31
2015 2014
Inventories (included in operating costs)
Property, plant and equipment (included in other gains and losses)
Intangible assets (including goodwill) (included in other gains and losses)
Prepayments (included in other gains and losses)
$ 1,939,446
524,247
-
2,395,643
$ 521,692
-
174,253
-
$4,859,336 $695,945