HTC 2015 Annual Report Download - page 70
Download and view the complete annual report
Please find page 70 of the 2015 HTC annual report below. You can navigate through the pages in the report by either clicking on the pages listed below, or by using the keyword search tool below to find specific information within the annual report.-
 1
1 -
2
-
3
-
4
-
5
-
6
-
7
-
8
-
9
-
10
-
11
-
12
-
13
-
14
-
15
-
16
-
17
-
18
-
19
-
20
-
21
-
22
-
23
-
24
-
25
-
26
-
27
-
28
-
29
-
30
-
31
-
32
-
33
-
34
-
35
-
36
-
37
-
38
-
39
-
40
-
41
-
42
-
43
-
44
-
45
-
46
-
47
-
48
-
49
-
50
-
51
-
52
-
53
-
54
-
55
-
56
-
57
-
58
-
59
-
 60
60 -
 61
61 -
 62
62 -
 63
63 -
 64
64 -
 65
65 -
 66
66 -
 67
67 -
 68
68 -
 69
69 -
 70
70 -
 71
71 -
 72
72 -
 73
73 -
 74
74 -
 75
75 -
 76
76 -
 77
77 -
 78
78 -
 79
79 -
 80
80 -
81
-
82
-
83
-
84
-
85
-
86
-
87
-
88
-
89
-
90
-
91
-
92
-
93
-
94
-
95
-
96
-
97
-
98
-
99
-
100
-
101
-
102
-
103
-
104
-
105
-
106
-
107
-
108
-
109
-
110
-
111
-
112
-
113
-
114
-
115
-
116
-
117
-
118
-
119
-
120
-
121
-
122
-
123
-
124
-
125
-
126
-
127
-
128
-
129
-
130
-
131
-
132
-
133
-
134
-
135
-
136
-
137
-
138
-
139
-
140
-
141
-
142
-
143
-
144
-
145
-
146
-
147
-
148
-
149
 |
 |

Financial status, operating results and risk management
Financial status, operating results and risk management
136
137
FINANCIAL STATUS,
OPERATING RESULTS
AND RISK MANAGEMENT
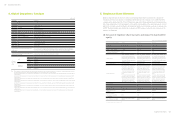
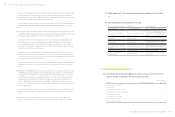
1. Financial Status
Unit: NT$ thousands
Item 2015 2014
Difference
Amount %
Current Assets 86,439,402 110,286,950 (23,847,548) ( 22 )
Properties 15,432,130 23,435,556 (8,003,426) (34)
IntangibleAssets 5,561,444 7,209,291 (1,647,847) (23)
Other Assets 21,960,107 22,906,477 (946,370) ( 4 )
Total Assets 129,393,083 163,838,274 (34,445,191) ( 21 )
Current Liabilities 64,473,478 83,258,739 (18,785,261) (23)
Non-current Liabilities 127,510 246,162 (118,652) ( 48 )
Total Liabilities 64,600,988 83,504,901 (18,903,913) (23)
Capital Stock 8,318,695 8,349,521 (30,826) 0
Capital Surplus 15,505,853 15,140,687 365,166 2
Retained Earnings 40,080,087 59,531,103 (19,451,016) (33)
Other Equity 1,088,415 1,062,118 26,297 2
Treasury Stock ( 200,955 ) (3,750,056) 3,549,101 ( 95 )
Non-ControllingInterest - - - -
Total Stockholders’ Equity 64,792,095 80,333,373 ( 15,541,278 ) ( 19 )
* All numbers above are based on consolidated financial statements.
(1) Explanations for any material changes in HTC's assets, liabilities,
and shareholders' equity in the most recent two fiscal years
Assets:
Current asset decreased from 2014 to 2015, mainly due to reduction in cash as we turned loss in 2015. Non-
current assets also decreased owing to impairment assessment and strict control on capital expenditure.
Debt:
Liabilities decreased from 2014 to 2015, mainly due to reduction in related purchasing, royalties and operation
related liabilities.
Shareholders' equity:
Shareholder’s equity decreased as we recorded loss in 2015. The amount of treasury stocks also decreased
because of the retirement of these treasury stocks.
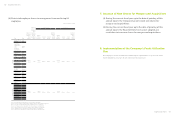
2. Operating Results
Unit: NT$ thousands
Item 2015 2014 Difference %
Revenues 121,684,231 187,911,200 (66,226,969) (35)
GrossProfit 21,953,107 40,755,095 ( 18,801,988 ) (46)
Operating(Loss)Profit (14,203,146) 668,770 (14,871,916) ( 2224 )
Non-operatingIncomeandExpenses (1,378,394) 1,314,656 (2,693,050) ( 205 )
NetIncome(Loss)BeforeTax ( 15,581,540 ) 1,983,426 (17,564,966) (886)
NetIncome(Loss)FromContinuingOperations (15,533,068) 1,483,046 (17,016,114) ( 1147 )
Non-Continuing Operations Loss - - - -
NetIncome(Loss) (15,533,068) 1,483,046 (17,016,114) ( 1147 )
OtherComprehensiveIncomeAndLossForTheYear,NetofIncomeTax (43,307) 873,654 (916,961) ( 105 )
TotalComprehensiveIncomeForTheYear (15,576,375) 2,356,700 (17,933,075) (761)
(Loss)ProfitForTheYearAttributableToOwnersOfTheParent (15,533,068) 1,483,046 (17,016,114) ( 1147 )
(Loss)ProfitForTheYearAttributableToNon-ControllingInterest - - - -
TotalComprehensiveIncomeAttributableToOwnersOftheParent (15,576,375) 2,356,700 (17,933,075) (761)
TotalComprehensiveIncomeAttributableToNon-ControllingInterest - - - -
EarningsPerShare ( 18.79 ) 1.80 ( 20.59 ) ( 1144 )
* All numbers above are based on consolidated financial statements.
(1) Explanations for any material changes in HTC's revenues,
operating income, and pre-tax income in the most recent two
fiscal years
Revenues and gross profit for 2015 decreased from 2014 as a result of intensified competition in global
smartphone market and product mix change. Despite a lowered operating expense, operating income for
2015 came in lower compared to 2014 as our business went through transition.
Non-operation income and expenses for 2015 decreased from 2014 due to impairment loss for some assets.
Change in comprehensive income for 2015 was due to recognizing exchange differences on translation of
overseas subsidiaries.