HTC 2015 Annual Report Download - page 61
Download and view the complete annual report
Please find page 61 of the 2015 HTC annual report below. You can navigate through the pages in the report by either clicking on the pages listed below, or by using the keyword search tool below to find specific information within the annual report.-
 1
1 -
2
-
3
-
4
-
5
-
6
-
7
-
8
-
9
-
10
-
11
-
12
-
13
-
14
-
15
-
16
-
17
-
18
-
19
-
20
-
21
-
22
-
23
-
24
-
25
-
26
-
27
-
28
-
29
-
30
-
31
-
32
-
33
-
34
-
35
-
36
-
37
-
38
-
39
-
40
-
41
-
42
-
43
-
44
-
45
-
46
-
47
-
48
-
49
-
50
-
 51
51 -
 52
52 -
 53
53 -
 54
54 -
 55
55 -
 56
56 -
 57
57 -
 58
58 -
 59
59 -
 60
60 -
 61
61 -
 62
62 -
 63
63 -
 64
64 -
 65
65 -
 66
66 -
 67
67 -
 68
68 -
 69
69 -
 70
70 -
 71
71 -
72
-
73
-
74
-
75
-
76
-
77
-
78
-
79
-
80
-
81
-
82
-
83
-
84
-
85
-
86
-
87
-
88
-
89
-
90
-
91
-
92
-
93
-
94
-
95
-
96
-
97
-
98
-
99
-
100
-
101
-
102
-
103
-
104
-
105
-
106
-
107
-
108
-
109
-
110
-
111
-
112
-
113
-
114
-
115
-
116
-
117
-
118
-
119
-
120
-
121
-
122
-
123
-
124
-
125
-
126
-
127
-
128
-
129
-
130
-
131
-
132
-
133
-
134
-
135
-
136
-
137
-
138
-
139
-
140
-
141
-
142
-
143
-
144
-
145
-
146
-
147
-
148
-
149
 |
 |

Capital and shares
Capital and shares
118
119
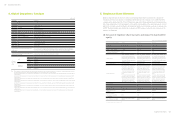
CAPITAL AND SHARES
NT$
Month/
Price
Paid-in
Other
03/1998 -
te 1
te 2
163.5 127,600,000 1,276,000,000 Note3
06/2002 162,720,000 1,627,200,000 te 4
09/2003 202,764,000 2,027,640,000 te 5
11/2003 131.1 217,164,000 2,171,640,000 Note6
03/2004 218,731,347 2,187,313,470 Merger te 7
271,427,616 2,714,276,160 te 8
276,311,395 2,763,113,950 ConversionofECB te 9
288,763,321 2,887,633,210 ConversionofECB te 9
357,015,985 3,570,159,850 te 10
08/2006 436,419,182 4,364,191,820 te 11
432,795,182 4,327,951,820 te 12
650,000,000 6,500,000,000 573,133,736 5,731,337,360 Note13
755,393,856 7,553,938,560 te 14
745,393,856 7,453,938,560 te 15
796,020,844 7,960,208,440 Note16
788,935,844 7,889,358,440 te 17
773,935,844 7,739,358,440 te 18
817,653,285 8,176,532,850 te 19
862,052,170 8,620,521,700 te 20
te 21
10/2013 850,139,538 8,501,395,380 te 22
11/2013 842,350,538 8,423,505,380 Note23
840,352,125 8,403,521,250 4
(Continued) (Continued)
1. Capital and Shares
(1) Capitalization:
2016.04.26Unit:Share;NT$
Month/
Year Price
Authorized Paid-in Remark
Shares Amount Shares Amount
Sources of
capital
Capital increase
by assets other
than cash Other
03/1998 10 19,500,000 195,000,000 19,500,000 195,000,000 Cash oering None -
10/1998 10 200,000,000 2,000,000,000 100,000,000 1,000,000,000 Cash oering None Note 1
08/2000 40 200,000,000 2,000,000,000 125,000,000 1,250,000,000 Cash oering None Note 2
04/2001 163.5 200,000,000 2,000,000,000 127,600,000 1,276,000,000 Cash oering None Note3
06/2002 10 200,000,000 2,000,000,000 162,720,000 1,627,200,000 Capitalization of
profits None Note 4
09/2003 10 270,000,000 2,700,000,000 202,764,000 2,027,640,000 Capitalization of
profits None Note 5
11/2003 131.1 270,000,000 2,700,000,000 217,164,000 2,171,640,000 Cash oering None Note6
03/2004 10 270,000,000 2,700,000,000 218,731,347 2,187,313,470 Merger None Note 7
08/2004 10 450,000,000 4,500,000,000 271,427,616 2,714,276,160 Capitalization of
profits None Note 8
01/2005 127.95 450,000,000 4,500,000,000 276,311,395 2,763,113,950 ConversionofECB None Note 9
04/2005 127.95 450,000,000 4,500,000,000 288,763,321 2,887,633,210 ConversionofECB None Note 9
09/2005 10 450,000,000 4,500,000,000 357,015,985 3,570,159,850 Capitalization of
profits None Note 10
08/2006 10 550,000,000 5,500,000,000 436,419,182 4,364,191,820 Capitalization of
profits None Note 11
04/2007 10 550,000,000 5,500,000,000 432,795,182 4,327,951,820
Capital reduction
: Cancellation of
Treasury Shares
None Note 12
09/2007 10 650,000,000 6,500,000,000 573,133,736 5,731,337,360 Capitalization of
profits None Note13
08/2008 10 1,000,000,000 10,000,000,000 755,393,856 7,553,938,560 Capitalization of
profits None Note 14
02/2009 10 1,000,000,000 10,000,000,000 745,393,856 7,453,938,560
Capital reduction
: Cancellation of
Treasury Shares
None Note 15
08/2009 10 1,000,000,000 10,000,000,000 796,020,844 7,960,208,440 Capitalization of
profits None Note16
Month/
Year Price
Authorized Paid-in Remark
Shares Amount Shares Amount
Sources of
capital
Capital increase
by assets other
than cash Other
11/2009 10 1,000,000,000 10,000,000,000 788,935,844 7,889,358,440
Capital reduction:
Cancellation of
Treasury Shares
None Note 17
04/2010 10 1,000,000,000 10,000,000,000 773,935,844 7,739,358,440
Capital reduction:
Cancellation of
Treasury Shares
None Note 18
08/2010 10 1,000,000,000 10,000,000,000 817,653,285 8,176,532,850 Capitalization of
profits None Note 19
07/2011 10 1,000,000,000 10,000,000,000 862,052,170 8,620,521,700 Capitalization of
profits None Note 20
12/2011 10 1,000,000,000 10,000,000,000 852,052,170 8,520,521,700
Capital reduction:
Cancellation of
Treasury Shares
None Note 21
10/2013 10 1,000,000,000 10,000,000,000 850,139,538 8,501,395,380
Capital reduction:
Cancellation of
Treasury Shares
None Note 22
11/2013 10 1,000,000,000 10,000,000,000 842,350,538 8,423,505,380
Capital reduction:
Cancellation of
Treasury Shares
None Note23
02/2014 10 1,000,000,000 10,000,000,000 840,352,125 8,403,521,250
Capital reduction:
Cancellation of
Treasury Shares
None Note 24
11/2014 10 1,000,000,000 10,000,000,000 830,352,125 8,303,521,250
Capital reduction:
Cancellation of
Treasury Shares
None Note 25
11/2014 10 1,000,000,000 10,000,000,000 834,952,125 8,349,521,250
Issuanceof
Restricted Employee
shares
None Note26
03/2015 10 1,000,000,000 10,000,000,000 828,038,125 8,280,381,250
Capital reduction:
Cancellation of
Treasury Shares
None Note 27
05/2015 10 1,000,000,000 10,000,000,000 827,988,925 8,279,889,250
Capital reduction:
Cancellation of
Restricted Employee
shares
None Note 28