HTC 2015 Annual Report Download - page 71
Download and view the complete annual report
Please find page 71 of the 2015 HTC annual report below. You can navigate through the pages in the report by either clicking on the pages listed below, or by using the keyword search tool below to find specific information within the annual report.-
 1
1 -
2
-
3
-
4
-
5
-
6
-
7
-
8
-
9
-
10
-
11
-
12
-
13
-
14
-
15
-
16
-
17
-
18
-
19
-
20
-
21
-
22
-
23
-
24
-
25
-
26
-
27
-
28
-
29
-
30
-
31
-
32
-
33
-
34
-
35
-
36
-
37
-
38
-
39
-
40
-
41
-
42
-
43
-
44
-
45
-
46
-
47
-
48
-
49
-
50
-
51
-
52
-
53
-
54
-
55
-
56
-
57
-
58
-
59
-
60
-
 61
61 -
 62
62 -
 63
63 -
 64
64 -
 65
65 -
 66
66 -
 67
67 -
 68
68 -
 69
69 -
 70
70 -
 71
71 -
 72
72 -
 73
73 -
 74
74 -
 75
75 -
 76
76 -
 77
77 -
 78
78 -
 79
79 -
 80
80 -
 81
81 -
82
-
83
-
84
-
85
-
86
-
87
-
88
-
89
-
90
-
91
-
92
-
93
-
94
-
95
-
96
-
97
-
98
-
99
-
100
-
101
-
102
-
103
-
104
-
105
-
106
-
107
-
108
-
109
-
110
-
111
-
112
-
113
-
114
-
115
-
116
-
117
-
118
-
119
-
120
-
121
-
122
-
123
-
124
-
125
-
126
-
127
-
128
-
129
-
130
-
131
-
132
-
133
-
134
-
135
-
136
-
137
-
138
-
139
-
140
-
141
-
142
-
143
-
144
-
145
-
146
-
147
-
148
-
149
 |
 |

Financial status, operating results and risk management
Financial status, operating results and risk management
138
139
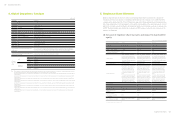
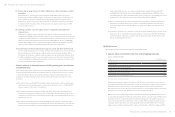
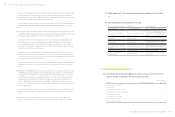
3. Cash Flows
(1) Analysis of change in cash flow for the most recent fiscal year
Year
Item 2015 2014 %
CashFlowRatio(%) ( 20.24 ) ( 0.41 ) (19.83)
CashFlowAdequacyRatio(%) 88.82 105.69 (16.87)
CashFlowReinvestmentRatio(%) (16.91) (0.36) (16.55)
Explanation and analysis of change:
As we recorded loss in 2015, our net cash outflow from operating activities saw an increase from the
previousyear,leadingtoloweredcashflowratioof-20.24%,cashflowadequacyratioof88.82%and
cashflowreinvestmentratioof-16.91%.
(2) Cash flow analysis for the coming year
Weexpectourcashon-handcanfullysupportcapitalexpendituresandallothercashneedsin2016.
4. The Effect on Financial Operations of Material Capital
Expenditures During the Most Recent Fiscal Year
(1) Review and analysis of material capital expenditures and funding
sources
1. Material capital expenditure and funding sources
None
2. Anticipated benefits
None
5. Investment Diversification in Recent Years
HTC's direct investment strategy focuses on the industry segments that enhance HTC's core businesses and
long-term strategic developments. Evaluation analysis is based on industry dynamics, market competition,
founding team experience, business model and risk analysis. The final goal is to make key strategic investments
(via minority or control) in companies and industries that strengthen HTC's product and service offerings and
its long-term competitiveness.
InordertobuildthevirtualrealityindustryandecosysteminrelevancetotheHTCViveheadset,HTChas
investedinkeystrategicvirtualrealitycompaniesin2015.KeyInvestmentsinclude:WEVRwithregardsto
virtual reality media networks, Surgical Theater in regards to its virtual reality applications in the medical
industry, Steel Wool Games in regards to virtual reality gaming, High Fidelity in regards to virtual reality social
media,andLarryEric&MoCo.inregardstovirtualrealityanimation.
6. Competitive Advantages, Business Growth and
Assessment of Risks
(1) Potential factors that may influence HTC's competitiveness/
business growth and related countermeasures
CriticalcompetitivefactorsinHTC'sindustryinclude:1)productR&Dandinnovationcapabilities,2)
strategicpartnershipswithindustryleadersand3)accurategraspofmarkettrends.Thefollowingassesses
HTC's competitiveness in terms of factors deemed to support and detract from HTC achieving its business
goals.
•FactorsfavorabletoHTCgrowth
(1) Partnerships with industry leaders help HTC drive industry trends
HTC has always developed smartphone products in close cooperation with industry leaders such as
Google®,Microsoft®,Qualcomm®aswellastheworld'sleadingtelecomoperators.Examplesinclude
HTC'slaunchoftheworld'sfirstWindowsMobilesmartphoneandfirstAndroidsmartphone.
Our strong partnerships deliver greater choice to consumers while continuing to drive industry
innovation.
(2) Long-term cooperative relationships with telecom providers keep HTC abreast of
consumer demand
HTC promotes products directly to mass-market consumers via long-term, unique relationships
with the world's largest telecommunications service providers that include the four big mobile
operatorsintheUnitedStates,fivemajoroperatorsinEuropeandseveralfastgrowingcarriersin
Asia. These relationships not only keep HTC abreast of user demand but also allow HTC to better
tailor its products and services to the needs of each carrier partner.