HTC 2015 Annual Report Download - page 120
Download and view the complete annual report
Please find page 120 of the 2015 HTC annual report below. You can navigate through the pages in the report by either clicking on the pages listed below, or by using the keyword search tool below to find specific information within the annual report.-
 1
1 -
2
-
3
-
4
-
5
-
6
-
7
-
8
-
9
-
10
-
11
-
12
-
13
-
14
-
15
-
16
-
17
-
18
-
19
-
20
-
21
-
22
-
23
-
24
-
25
-
26
-
27
-
28
-
29
-
30
-
31
-
32
-
33
-
34
-
35
-
36
-
37
-
38
-
39
-
40
-
41
-
42
-
43
-
44
-
45
-
46
-
47
-
48
-
49
-
50
-
51
-
52
-
53
-
54
-
55
-
56
-
57
-
58
-
59
-
60
-
61
-
62
-
63
-
64
-
65
-
66
-
67
-
68
-
69
-
70
-
71
-
72
-
73
-
74
-
75
-
76
-
77
-
78
-
79
-
80
-
81
-
82
-
83
-
84
-
85
-
86
-
87
-
88
-
89
-
90
-
91
-
92
-
93
-
94
-
95
-
96
-
97
-
98
-
99
-
100
-
101
-
102
-
103
-
104
-
105
-
106
-
107
-
108
-
109
-
 110
110 -
 111
111 -
 112
112 -
 113
113 -
 114
114 -
 115
115 -
 116
116 -
 117
117 -
 118
118 -
 119
119 -
 120
120 -
 121
121 -
 122
122 -
 123
123 -
 124
124 -
 125
125 -
 126
126 -
 127
127 -
 128
128 -
 129
129 -
 130
130 -
131
-
132
-
133
-
134
-
135
-
136
-
137
-
138
-
139
-
140
-
141
-
142
-
143
-
144
-
145
-
146
-
147
-
148
-
149
 |
 |

Financial information
Financial information
236
237
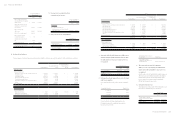
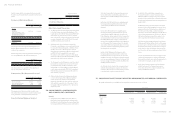
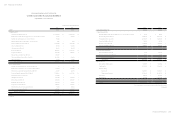
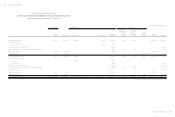
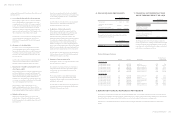
HTC CORPORATION AND SUBSIDIARIES
CONSOLIDATED STATEMENTS OF COMPREHENSIVE INCOME
FOR THE YEARS ENDED DECEMBER 31, 2015 AND 2014
(In Thousands of New Taiwan Dollars, Except (Loss) Earnings Per Share))
2015 2014
Amount % Amount %
OPERATING REVENUES (Notes 8, 25 and 32) $ 121,684,231 100 $ 187,911,200 100
OPERATING COSTS (Notes 12, 23, 26 and 32) 99,731,124 82 147,156,105 78
GROSS PROFIT 21,953,107 18 40,755,095 22
OPERATING EXPENSES (Notes 23, 26 and 32)
Selling and marketing 17,452,673 15 21,834,286 12
General and administrative 4,975,964 4 5,204,788 3
Research and development 13,727,616 11 13,047,251 7
Total operating expenses 36,156,253 30 40,086,325 22
(LOSS) PROFIT FROM OPERATIONS ( 14,203,146) (12) 668,770 -
NON-OPERATING INCOME AND EXPENSES
Other income (Note 26) 928,036 1 834,124 1
Other gains and losses (Notes 8, 9 and 26) ( 2,286,659) ( 2) 506,194 -
Finance costs ( 8,123) - ( 16,983) -
Share of the profit or loss of associates and joint ventures (Note 16) ( 11,648) - ( 8,679) -
Total non-operating income and expenses ( 1,378,394) ( 1) 1,314,656 1
(LOSS) PROFIT BEFORE INCOME TAX ( 15,581,540) (13) 1,983,426 1
INCOME TAX (BENEFIT) EXPENSE (Note 27) ( 48,472) - 500,380 -
(LOSS) PROFIT FOR THE YEAR ( 15,533,068) (13) 1,483,046 1
(Continued)
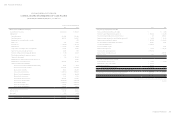
2015 2014
Amount % Amount %
OTHER COMPREHENSIVE (LOSS) INCOME, NET OF INCOME TAX
Items that will not be reclassified to profit or loss:
Remeasurement of defined benefit plans (Note 23) $( 48,216) - $ ( 33,346) -
Income tax relating to items that will not be reclassified to profit or loss (Note 27) 5,813 - 4,010 -
( 42,403) - ( 29,336) -
Items that may be reclassified subsequently to profit or loss:
Exchange differences on translating foreign operations 10,562 - 903,136 -
Unrealized losses on available-for-sale financial assets ( 11,466) - ( 146) -
( 904) - 902,990 -
Other comprehensive (loss) income for the year, net of income tax ( 43,307) - 873,654 -
TOTAL COMPREHENSIVE (LOSS) INCOME FOR THE YEAR $(15,576,375) (13) $ 2,356,700 1
NET (LOSS) PROFIT FOR THE YEAR ATTRIBUTABLE TO
Owners of the parent $(15,533,068) (13) $ 1,483,046 1
TOTAL COMPREHENSIVE (LOSS) INCOME FOR THE YEAR ATTRIBUTABLE TO
Owners of the parent $(15,576,375) (13) $ 2,356,700 1
(LOSS) EARNINGS PER SHARE (Note 28)
Basic $( 18.79) $ 1.80
Diluted $( 18.79) $ 1.80
The accompanying notes are an integral part of the consolidated financial statements.
(Concluded)