HTC 2015 Annual Report Download - page 134
Download and view the complete annual report
Please find page 134 of the 2015 HTC annual report below. You can navigate through the pages in the report by either clicking on the pages listed below, or by using the keyword search tool below to find specific information within the annual report.-
 1
1 -
2
-
3
-
4
-
5
-
6
-
7
-
8
-
9
-
10
-
11
-
12
-
13
-
14
-
15
-
16
-
17
-
18
-
19
-
20
-
21
-
22
-
23
-
24
-
25
-
26
-
27
-
28
-
29
-
30
-
31
-
32
-
33
-
34
-
35
-
36
-
37
-
38
-
39
-
40
-
41
-
42
-
43
-
44
-
45
-
46
-
47
-
48
-
49
-
50
-
51
-
52
-
53
-
54
-
55
-
56
-
57
-
58
-
59
-
60
-
61
-
62
-
63
-
64
-
65
-
66
-
67
-
68
-
69
-
70
-
71
-
72
-
73
-
74
-
75
-
76
-
77
-
78
-
79
-
80
-
81
-
82
-
83
-
84
-
85
-
86
-
87
-
88
-
89
-
90
-
91
-
92
-
93
-
94
-
95
-
96
-
97
-
98
-
99
-
100
-
101
-
102
-
103
-
104
-
105
-
106
-
107
-
108
-
109
-
110
-
111
-
112
-
113
-
114
-
115
-
116
-
117
-
118
-
119
-
120
-
121
-
122
-
123
-
 124
124 -
 125
125 -
 126
126 -
 127
127 -
 128
128 -
 129
129 -
 130
130 -
 131
131 -
 132
132 -
 133
133 -
 134
134 -
 135
135 -
 136
136 -
 137
137 -
 138
138 -
 139
139 -
 140
140 -
 141
141 -
 142
142 -
 143
143 -
 144
144 -
145
-
146
-
147
-
148
-
149
 |
 |
Financial information
Financial information
264
265
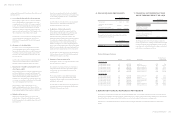
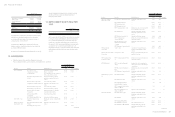
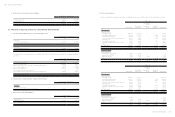
17. PROPERTY, PLANT AND EQUIPMENT
December 31
2015 2014
Carrying amounts
Land
Buildings
Property in construction
Machinery and equipment
Other equipment
$ 6,470,507
5,771,213
-
2,320,672
869,738
$ 7,622,683
10,364,729
1,089
4,437,725
1,009,330
$15,432,130 $ 23,435,556
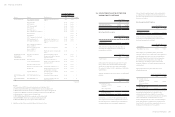
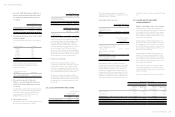
Movement of property, plant and equipment for the years ended December 31, 2015 and 2014 were as follows:
2015
Land Buildings
Property in
Construction
Machinery and
Equipment
Other
Equipment Total
Cost
Balance, beginning of the year
Additions
Disposals
Transfer to expense
Reclassification
Effect of foreign currency exchange
differences
$ 7,622,683
-
-
-
( 1,151,354)
( 822)
$ 12,508,315
142,865
( 378,465)
-
( 4,889,015)
( 22,332)
$ 1,089
1,475
(2,556)
-
-
( 8)
$ 15,181,539
361,273
( 1,735,045)
( 8,577)
-
( 44,785)
$ 2,656,990
415,936
( 446,392)
-
( 120,162)
966
$ 37,970,616
921,549
( 2,562,458)
( 8,577)
( 6,160,531)
( 66,981)
Balance, end of the year 6,470,507 7,361,368 - 13,754,405 2,507,338 30,093,618
Accumulated depreciation
Balance, beginning of the year
Depreciation expenses
Disposals
Transfer to expense
Reclassification
Effect of foreign currency exchange
differences
-
-
-
-
-
-
2,143,586
406,210
( 373,693)
-
( 583,994)
( 1,954)
-
-
-
-
-
-
10,743,814
1,685,763
( 1,487,187)
( 238)
-
( 29,382)
1,647,660
433,218
( 364,499)
-
( 81,848)
( 215)
14,535,060
2,525,191
( 2,225,379)
( 238)
( 665,842)
( 31,551)
Balance, end of the year - 1,590,155 - 10,912,770 1,634,316 14,137,241
Accumulated impairment
Balance, beginning of the year
Impairment losses
-
-
-
-
-
-
-
520,963
-
3,284
-
524,247
Balance, end of the year - - - 520,963 3,284 524,247
Net book value, end of the year $ 6,470,507 $ 5,771,213 $ - $ 2,320,672 $ 869,738 $ 15,432,130
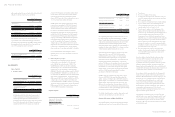
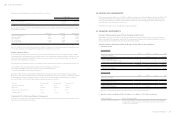
2014
Land Buildings
Property in
Construction
Machinery and
Equipment
Other
Equipment Total
Cost
Balance, beginning of the year
Additions
Disposal
Reclassification
Effect of foreign currency exchange
differences
$ 7,623,287
-
-
-
( 604)
$ 12,229,591
223,122
-
-
55,602
$ 145
1,053
-
( 147)
38
$ 14,480,912
570,963
( 274)
-
129,938
$ 3,564,884
87,266
( 1,039,424)
147
44,117
$ 37,898,819
882,404
( 1,039,698)
-
229,091
2014
Land Buildings
Property in
Construction
Machinery and
Equipment
Other
Equipment Total
Balance, end of the year $ 7,622,683 $ 12,508,315 $ 1,089 $ 15,181,539 $ 2,656,990 $ 37,970,616
Accumulated depreciation
Balance, beginning of the year
Depreciation expenses
Disposal
Effect of foreign currency exchange
differences
-
-
-
-
1,722,043
416,707
-
4,836
-
-
-
-
8,718,986
1,940,537
( 192)
84,483
1,896,391
595,648
( 869,996)
25,617
12,337,420
2,952,892
( 870,188)
114,936
Balance, end of the year - 2,143,586 - 10,743,814 1,647,660 14,535,060
Net book value, end of the year $ 7,622,683 $ 10,364,729 $ 1,089 $ 4,437,725 $ 1,009,330 $ 23,435,556
(Concluded)
The above items of property, plant and equipment were
depreciated on a straight-line basis over the estimated useful
lives as follows:
Building 5-50 years
Machinery and equipment 3-6 years
Other equipment 3-5 years
The major component parts of the buildings held by the
Company included plants, electro-powering machinery and
engineering systems, etc., which were depreciated over their
estimated useful lives of 40 to 50 years, 20 years and 5 to 10
years, respectively.
There were no interests capitalized for the years ended
December 31, 2015 and 2014.
18. INVESTMENT PROPERTIES, NET
Movement of investment properties, net for the year ended
December 31, 2015 was as follows:
2015
Completed Investment
Property
Cost
Balance, beginning of the year
Transferred from property, plant and
equipment
Effect of foreign currency exchange
differences
$ -
1,997,596
( 4,798)
Balance, end of the year 1,992,798
Accumulated depreciation
Balance, beginning of the year
Transferred from property, plant and
equipment
Depreciation expense
-
271,184
13,855
2015
Completed Investment
Property
Effect of foreign currency exchange
differences $ ( 730)
Balance, end of the year 284,309
Net book value, end of the year $ 1,708,489
(Concluded)
The investment properties were depreciated using the
straight-line method over their estimated useful lives as
follows:
Main buildings 50 years
Air-conditioning 5-10 years
Others 3-5 years
In October, 2015, the determination of fair value was
performed by qualified professional valuers, and the fair
value was measured by using Level 3 inputs. The valuation
was arrived at by reference to cost method. The significant
unobservable inputs used include residue ratio. The
evaluated fair value was NT$1,949,221 thousand with an
assessment by qualified professional valuers as no significant
changes so as to the date of the balance sheet.
19. INTANGIBLE ASSETS
December 31
2015 2014
Carrying amounts
Patents
Other intangible assets
$4,986,922
574,522
$6,418,735
790,556
$ 5,561,444 $7,209,291
(Continued)
(Continued)