HTC 2015 Annual Report Download - page 107
Download and view the complete annual report
Please find page 107 of the 2015 HTC annual report below. You can navigate through the pages in the report by either clicking on the pages listed below, or by using the keyword search tool below to find specific information within the annual report.-
 1
1 -
2
-
3
-
4
-
5
-
6
-
7
-
8
-
9
-
10
-
11
-
12
-
13
-
14
-
15
-
16
-
17
-
18
-
19
-
20
-
21
-
22
-
23
-
24
-
25
-
26
-
27
-
28
-
29
-
30
-
31
-
32
-
33
-
34
-
35
-
36
-
37
-
38
-
39
-
40
-
41
-
42
-
43
-
44
-
45
-
46
-
47
-
48
-
49
-
50
-
51
-
52
-
53
-
54
-
55
-
56
-
57
-
58
-
59
-
60
-
61
-
62
-
63
-
64
-
65
-
66
-
67
-
68
-
69
-
70
-
71
-
72
-
73
-
74
-
75
-
76
-
77
-
78
-
79
-
80
-
81
-
82
-
83
-
84
-
85
-
86
-
87
-
88
-
89
-
90
-
91
-
92
-
93
-
94
-
95
-
96
-
 97
97 -
 98
98 -
 99
99 -
 100
100 -
 101
101 -
 102
102 -
 103
103 -
 104
104 -
 105
105 -
 106
106 -
 107
107 -
 108
108 -
 109
109 -
 110
110 -
 111
111 -
 112
112 -
 113
113 -
 114
114 -
 115
115 -
 116
116 -
 117
117 -
118
-
119
-
120
-
121
-
122
-
123
-
124
-
125
-
126
-
127
-
128
-
129
-
130
-
131
-
132
-
133
-
134
-
135
-
136
-
137
-
138
-
139
-
140
-
141
-
142
-
143
-
144
-
145
-
146
-
147
-
148
-
149
 |
 |

Financial information
Financial information
210
211
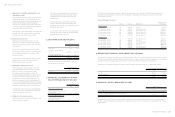
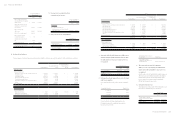
At the end of the reporting period, the proportion of
ownership and voting rights in subsidiaries held by the
Company were as follows:
December 31
2015 2014
H.T.C. (B.V.I.) Corp. 100.00% 100.00%
Communication Global Certification Inc. 100.00% 100.00%
High Tech Computer Asia Pacific Pte.
Ltd. 100.00% 100.00%
HTC Investment Corporation 100.00% 100.00%
PT. High Tech Computer Indonesia 1.00% 1.00%
HTC I Investment Corporation 100.00% 100.00%
HTC Holding Cooperatief U.A. 0.01% 0.01%
HTC Investment One (BVI) Corporation 100.00% 100.00%
HTC Investment (BVI) Corp. 100.00% -
HTC VIVE Holding (BVI) Corp. 100.00% -
Refer to Note 15 to the consolidated financial statements
for the year ended December 31, 2015 for the details of the
subsidiaries indirectly held by the Company.
The Company and its subsidiary, High Tech Computer Asia
Pacific Pte. Ltd., acquired equity interests of 1% and 99%,
respectively, in PT. High Tech Computer Indonesia and
acquired equity interests of 0.01% and 99.99%, respectively,
in HTC Holding Cooperatief U.A. As a result, PT. High Tech
Computer Indonesia and HTC Holding Cooperatief U.A. are
considered as subsidiaries of the Company.
The share of net income or loss and other comprehensive
income from subsidiaries under equity method were
accounted for based on the audited financial statements.
Investments in Joint Ventures
December 31
2015 2014
Unlisted equity investments
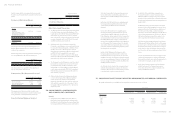
Huada Digital Corporation $208,312 $218,825
At the end of the reporting period, the proportion of
ownership and voting rights in joint ventures held by the
Company were as follows:
December 31
Name of Joint Venture 2015 2014
Huada Digital Corporation 50.00% 50.00%
The Company set up a subsidiary Huada, whose main
business is software services, in December 2009. In October
2011, Chunghwa Telecom Co., Ltd. invested in Huada. In
March 2012, Huada held a stockholders' meeting and re-
elected its directors and supervisors. As a result, the
investment type was changed to joint venture and the
Company continued to account for this investment by the
equity method.
Aggregate information of joint ventures that are not
individually material:
For the Year Ended
December 31
2015 2014
The Company's share of:
Losses from continuing operations $(10,513) $(8,679)
Other comprehensive income - -
Total comprehensive losses for the
period $(10,513) $(8,679)
Investments in joint ventures accounted for by the
equity method and the share of profit or loss and other
comprehensive income of those investments were calculated
based on the financial statements that have not been
audited. Management believes there is no material impact
on the equity method accounting or the calculation of the
share of profit or loss and other comprehensive income, as
the financial statement have not been audited.
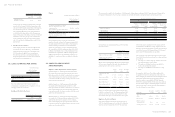
15. PROPERTY, PLANT AND EQUIPMENT
December 31
2015 2014
Carrying amounts
Land
Buildings
Machinery and equipment
Other equipment
$ 6,311,135
5,249,869
1,227,343
364,519
$ 7,462,489
8,096,521
2,641,228
459,870
$13,152,866 $18,660,108
Movement of property, plant and equipment for the years
ended December 31, 2015 and 2014 were as follows:
2015
Land Buildings Machinery and Equipment Other Equipment Total
Cost
Balance, beginning of the year
Additions
Disposals
Transfer to expense
Reclassification
$ 7,462,489
-
-
-
( 1,151,354)
$ 10,027,634
139,854
( 373,285)
-
( 3,011,581)
$ 10,095,828
163,046
( 547,015)
( 8,577)
-
$ 1,283,307
70,714
( 82,794)
-
-
$ 28,869,258
373,614
( 1,003,094)
( 8,577)
( 4,162,935)
Balance, end of the year 6,311,135 6,782,622 9,703,282 1,271,227 24,068,266
Accumulated depreciation
Balance, beginning of the year
Depreciation expenses
Disposals
Transfer to expense
Reclassification
-
-
-
-
-
1,931,113
369,583
( 373,285)
-
( 394,658)
7,454,600
1,047,596
( 546,982)
( 238)
-
823,437
162,781
( 82,794)
-
-
10,209,150
1,579,960
( 1,003,061)
( 238)
( 394,658)
Balance, end of the year - 1,532,753 7,954,976 903,424 10,391,153
Accumulated impairment
Balance, beginning of the year
Impairment losses
-
-
-
-
-
520,963
-
3,284
-
524,247
Balance, end of the year - - 520,963 3,284 524,247
Net book value, end of the year $ 6,311,135 $ 5,249,869 $ 1,227,343 $ 364,519 $ 13,152,866
2014
Land Buildings Machinery and Equipment Other Equipment Total
Cost
Balance, beginning of the year
Additions
$7,462,489
-
$ 9,804,511
223,123
$ 9,743,475
352,353
$ 1,197,501
85,806
$28,207,976
661,282
Balance, end of the year 7,462,489 10,027,634 10,095,828 1,283,307 28,869,258
Accumulated depreciation
Balance, beginning of the year
Depreciation expenses
-
-
1,559,449
371,664
6,214,205
1,240,395
660,714
162,723
8,434,368
1,774,782
Balance, end of the year - 1,931,113 7,454,600 823,437 10,209,150
Net book value, end of the year $7,462,489 $ 8,096,521 $ 2,641,228 $ 459,870 $ 18,660,108
The above items of property, plant and equipment were depreciated on a straight-line basis over the estimated useful lives as follows:
Building 5-50 years
Machinery and equipment 3-6 years
Other equipment 3-5 years
The major component parts of the buildings held by the Company included plants, electro-powering machinery and engineering
systems, etc., which were depreciated over their estimated useful lives of 40 to 50 years, 20 years and 5 to 10 years, respectively.
There were no interests capitalized for the years ended December 31, 2015 and 2014.