HTC 2015 Annual Report Download - page 119
Download and view the complete annual report
Please find page 119 of the 2015 HTC annual report below. You can navigate through the pages in the report by either clicking on the pages listed below, or by using the keyword search tool below to find specific information within the annual report.-
 1
1 -
2
-
3
-
4
-
5
-
6
-
7
-
8
-
9
-
10
-
11
-
12
-
13
-
14
-
15
-
16
-
17
-
18
-
19
-
20
-
21
-
22
-
23
-
24
-
25
-
26
-
27
-
28
-
29
-
30
-
31
-
32
-
33
-
34
-
35
-
36
-
37
-
38
-
39
-
40
-
41
-
42
-
43
-
44
-
45
-
46
-
47
-
48
-
49
-
50
-
51
-
52
-
53
-
54
-
55
-
56
-
57
-
58
-
59
-
60
-
61
-
62
-
63
-
64
-
65
-
66
-
67
-
68
-
69
-
70
-
71
-
72
-
73
-
74
-
75
-
76
-
77
-
78
-
79
-
80
-
81
-
82
-
83
-
84
-
85
-
86
-
87
-
88
-
89
-
90
-
91
-
92
-
93
-
94
-
95
-
96
-
97
-
98
-
99
-
100
-
101
-
102
-
103
-
104
-
105
-
106
-
107
-
108
-
 109
109 -
 110
110 -
 111
111 -
 112
112 -
 113
113 -
 114
114 -
 115
115 -
 116
116 -
 117
117 -
 118
118 -
 119
119 -
 120
120 -
 121
121 -
 122
122 -
 123
123 -
 124
124 -
 125
125 -
 126
126 -
 127
127 -
 128
128 -
 129
129 -
130
-
131
-
132
-
133
-
134
-
135
-
136
-
137
-
138
-
139
-
140
-
141
-
142
-
143
-
144
-
145
-
146
-
147
-
148
-
149
 |
 |
Financial information
Financial information
234
235
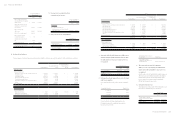
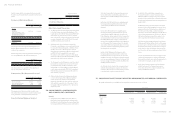
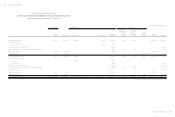
HTC CORPORATION AND SUBSIDIARIES
CONSOLIDATED BALANCE SHEETS
DECEMBER 31, 2015 AND 2014
(In Thousands of New Taiwan Dollars)
2015 2014
ASSETS Amount % Amount %
CURRENT ASSETS
Cash and cash equivalents (Note 6) $ 35,346,799 27 $ 55,743,558 34
Financial assets at fair value through profit or loss - current (Notes 7 and 31) 95,493 - 262,544 -
Available-for-sale financial assets - current (Note 31) 303,289 - - -
Debt investments with no active market - current (Note 31) 8,266 - 7,918 -
Trade receivables, net (Notes 11 and 32) 18,518,948 14 29,140,284 18
Other receivables (Note 11) 466,791 1 584,936 -
Current tax assets (Note 27) 212,033 - 274,321 -
Inventories (Note 12) 19,123,637 15 17,213,060 11
Prepayments (Note 13) 4,400,968 4 6,626,106 4
Non-current assets held for sale (Note 14) 3,768,277 3 - -
Other current financial assets (Notes 10 and 33) 4,100,290 3 334,954 -
Other current assets 94,611 - 99,269 -
Total current assets 86,439,402 67 110,286,950 67
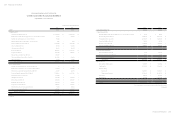
NON-CURRENT ASSETS
Available-for-sale financial assets - non-current (Note 31) 75 - 93 -
Financial assets measured at cost - non-current (Notes 9 and 31) 3,396,151 3 2,586,478 2
Investments accounted for using equity method (Note 16) 240,237 - 234,661 -
Property, plant and equipment (Notes 17 and 32) 15,432,130 12 23,435,556 14
Investment properties, net (Note 18) 1,708,489 1 - -
Intangible assets (Note 19) 5,561,444 4 7,209,291 5
Deferred tax assets (Note 27) 8,699,322 7 8,452,707 5
Refundable deposits (Note 31) 1,580,342 1 262,740 -
Long-term receivables (Note 11) 1,488,775 1 1,342,813 1
Net defined benefit asset - non-current (Note 23) 79,470 - 109,138 -
Other non-current assets (Note 13) 4,767,246 4 9,917,847 6
Total non-current assets 42,953,681 33 53,551,324 33
TOTAL $129,393,083 100 $163,838,274 100
(Continued)
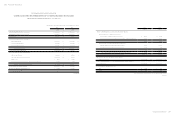
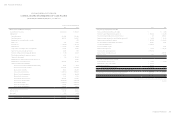
2015 2014
LIABILITIES AND EQUITY Amount % Amount %
CURRENT LIABILITIES
Financial liabilities at fair value through profit or loss - current (Notes 7 and 31) $ 36,544 - $ 22,424 -
Note and trade payables (Note 20) 29,598,385 23 43,803,343 27
Other payables (Notes 21 and 32) 24,993,276 19 32,237,945 20
Current tax liabilities (Note 27) 163,252 - 210,714 -
Provisions - current (Note 22) 5,992,258 5 5,841,179 3
Other current liabilities (Note 21) 3,689,763 3 1,143,134 1
Total current liabilities 64,473,478 50 83,258,739 51
NON-CURRENT LIABILITIES
Deferred tax liabilities (Note 27) 97,351 - 202,932 -
Guarantee deposits received (Note 31) 30,159 - 43,230 -
Total non-current liabilities 127,510 - 246,162 -
Total liabilities 64,600,988 50 83,504,901 51
EQUITY (Note 24)
Share capital - ordinary shares 8,318,695 6 8,349,521 5
Capital surplus 15,505,853 12 15,140,687 9
Retained earnings
Legal reserve 18,297,655 14 18,149,350 11
Unappropriated earnings 21,782,432 17 41,381,753 25
Other equity 1,088,415 1 1,062,118 1
Treasury shares ( 200,955) - ( 3,750,056) ( 2)
Total equity 64,792,095 50 80,333,373 49
TOTAL $ 129,393,083 100 $ 163,838,274 100
The accompanying notes are an integral part of the consolidated financial statements.
(Concluded)