HTC 2015 Annual Report Download - page 106
Download and view the complete annual report
Please find page 106 of the 2015 HTC annual report below. You can navigate through the pages in the report by either clicking on the pages listed below, or by using the keyword search tool below to find specific information within the annual report.-
 1
1 -
2
-
3
-
4
-
5
-
6
-
7
-
8
-
9
-
10
-
11
-
12
-
13
-
14
-
15
-
16
-
17
-
18
-
19
-
20
-
21
-
22
-
23
-
24
-
25
-
26
-
27
-
28
-
29
-
30
-
31
-
32
-
33
-
34
-
35
-
36
-
37
-
38
-
39
-
40
-
41
-
42
-
43
-
44
-
45
-
46
-
47
-
48
-
49
-
50
-
51
-
52
-
53
-
54
-
55
-
56
-
57
-
58
-
59
-
60
-
61
-
62
-
63
-
64
-
65
-
66
-
67
-
68
-
69
-
70
-
71
-
72
-
73
-
74
-
75
-
76
-
77
-
78
-
79
-
80
-
81
-
82
-
83
-
84
-
85
-
86
-
87
-
88
-
89
-
90
-
91
-
92
-
93
-
94
-
95
-
 96
96 -
 97
97 -
 98
98 -
 99
99 -
 100
100 -
 101
101 -
 102
102 -
 103
103 -
 104
104 -
 105
105 -
 106
106 -
 107
107 -
 108
108 -
 109
109 -
 110
110 -
 111
111 -
 112
112 -
 113
113 -
 114
114 -
 115
115 -
 116
116 -
117
-
118
-
119
-
120
-
121
-
122
-
123
-
124
-
125
-
126
-
127
-
128
-
129
-
130
-
131
-
132
-
133
-
134
-
135
-
136
-
137
-
138
-
139
-
140
-
141
-
142
-
143
-
144
-
145
-
146
-
147
-
148
-
149
 |
 |

Financial information
Financial information
208
209
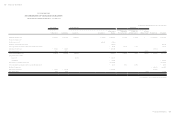
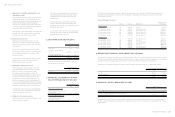
10. TRADE RECEIVABLES AND OTHER
RECEIVABLES
December 31
2015 2014
Trade receivables
Trade receivables
Trade receivables - related parties
Less: Allowances for impairment loss
$ 9,023,892
7,955,352
( 3,012,869)
$ 15,455,951
16,250,234
( 3,050,907)
$ 13,966,375 $ 28,655,278
Other receivables
VAT refund receivables
Interest receivables
Others
$ 132,110
1,013
124,377
$ 58,468
8,592
257,367
$ 257,500 $ 324,427
Trade Receivables
The credit period on sales of goods is 30-75 days. No
interest is charged on trade receivables before the due
date. Thereafter, interest is charged at 1-18% per annum
on the outstanding balance, which is considered to be non-
controversial, to some of customers. In determining the
recoverability of a trade receivable, the Company considered
any change in the credit quality of the trade receivable
since the date credit was initially granted to the end of
the reporting period. For customers with low credit risk,
the Company has recognized an allowance for doubtful
debts of 1-5% against receivables past due beyond 31-90
days and of 5-100% against receivables past due beyond 91
days. For customers with high credit risk, the Company has
recognized an allowance for impairment loss of 10-100%
against receivables past due more than 31 days.
Before accepting any new customer, the Company's
Department of Financial and Accounting evaluates the
potential customer's credit quality and defines credit limits
and scorings by customer. The factor of overdue attributed
to customers are reviewed once a week and the Company
evaluates the financial performance periodically for the
adjustment of credit limits.
The concentration of credit risk is limited due to the fact
that the customer base is diverse.
As of the reporting date, the Company had no receivables
that are past due but not impaired.
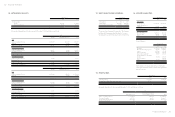
Age of trade receivables
December 31
2015 2014
1-90 days $6,050,058 $ 8,460,909
91-180 days 674,498 281,674
Over 181 days 1,540,635 6,491,590
$ 8,265,191 $15,234,173
The above aging schedule was based on the past due date.
Age of impaired trade receivables
December 31
2015 2014
1-90 days $5,252,322 $ 8,233,369
91-180 days - 3,949,897
Over 181 days - -
$5,252,322 $12,183,266
The above aging of trade receivables after deducting the
allowance for impairment loss were presented based on the
past due date.
The movements of the allowance for doubtful trade
receivables were as follows:
Movement in the allowances for impairment loss
For the Year Ended
December 31
2015 2014
Balance, beginning of the year $ 3,050,907 $3,050,907
Less: Amounts written off as
uncollectible ( 38,038) -
Balance, end of the year $ 3,012,869 $3,050,907
Other Receivables
Others were primarily prepayments on behalf of vendors or
customers and grants from suppliers.
11. INVENTORIES
December 31
2015 2014
Finished goods
Work-in-process
Semi-finished goods
Raw materials
Inventory in transit
$ 1,740,629
447,708
2,615,846
10,425,440
604,543
$ 1,009,421
697,801
3,188,532
9,096,247
438,308
$15,834,166 $14,430,309
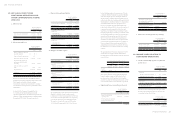
The cost of inventories recognized as cost of goods sold
for the years ended December 31, 2015 and 2014 included
inventory write-downs of NT$2,150,302 thousand and
NT$557,580 thousand, respectively.
12. PREPAYMENTS
December 31
2015 2014
Royalty
Prepayments to suppliers
Software and hardware maintenance
Service
Prepaid equipment
Others
$7,033,244
251,338
176,955
159,781
78,888
195,547
$10,796,985
1,575,529
202,835
197,702
126,878
136,313
$7,895,753 $13,036,242
Current
Non-current
$3,377,222
4,518,531
$ 4,630,779
8,405,463
$7,895,753 $13,036,242
Prepayments for royalty were primarily for getting royalty
right and were classified as current or non-current in
accordance with their nature. For details of content of
contracts, please refer to Note 32.
Prepayments to suppliers were primarily for discount
purposes and were classified as current or non-current in
accordance with their nature.
In June 2015, the Company determined that the recoverable
amount of partial prepayments was less than its carrying
amount, and thus recognized an impairment loss of
NT$1,268,643 thousand.
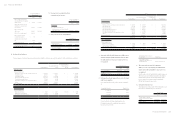
13. NON-CURRENT ASSETS HELD FOR
SALE
December 31
2015 2014
Land and buildings held for sale $3,768,277 $ -
On December 29, 2015, the Company's board of directors
resolved to sell a plot of land and buildings to Inventec
Corporation for a total amount of NT$6,060,000 thousand.
Since the transfer process of this transaction was not
completed on December 31, 2015, the land and building were
temporarily accounted for as “non-current assets held for
sale”. No impairment loss was recognized on classification
of the land and buildings as held for sale for the year ended
December 31, 2015.
14. INVESTMENTS ACCOUNTED FOR
USING EQUITY METHOD
December 31
2015 2014
Investment in subsidiaries $41,272,544 $42,276,929
Investment in joint ventures 208,312 218,825
$ 41,480,856 $42,495,754
Investments in Subsidiaries
December 31
2015 2014
Unlisted equity investments
H.T.C. (B.V.I.) Corp. $ 3,311,970 $ 2,915,646
Communication Global
Certification Inc. 400,897 434,336
High Tech Computer Asia Pacific
Pte. Ltd. 31,366,465 32,416,366
HTC Investment Corporation 287,186 284,774
PT. High Tech Computer Indonesia 62 62
HTC I Investment Corporation 261,996 260,949
HTC Holding Cooperatief U.A. 13 13
HTC Investment One (BVI)
Corporation 5,003,823 5,964,783
HTC Investment (BVI) Corp. 638,990 -
HTC VIVE Holding (BVI) Corp. 1,142 -
$41,272,544 $42,276,929