HTC 2015 Annual Report Download - page 143
Download and view the complete annual report
Please find page 143 of the 2015 HTC annual report below. You can navigate through the pages in the report by either clicking on the pages listed below, or by using the keyword search tool below to find specific information within the annual report.-
 1
1 -
2
-
3
-
4
-
5
-
6
-
7
-
8
-
9
-
10
-
11
-
12
-
13
-
14
-
15
-
16
-
17
-
18
-
19
-
20
-
21
-
22
-
23
-
24
-
25
-
26
-
27
-
28
-
29
-
30
-
31
-
32
-
33
-
34
-
35
-
36
-
37
-
38
-
39
-
40
-
41
-
42
-
43
-
44
-
45
-
46
-
47
-
48
-
49
-
50
-
51
-
52
-
53
-
54
-
55
-
56
-
57
-
58
-
59
-
60
-
61
-
62
-
63
-
64
-
65
-
66
-
67
-
68
-
69
-
70
-
71
-
72
-
73
-
74
-
75
-
76
-
77
-
78
-
79
-
80
-
81
-
82
-
83
-
84
-
85
-
86
-
87
-
88
-
89
-
90
-
91
-
92
-
93
-
94
-
95
-
96
-
97
-
98
-
99
-
100
-
101
-
102
-
103
-
104
-
105
-
106
-
107
-
108
-
109
-
110
-
111
-
112
-
113
-
114
-
115
-
116
-
117
-
118
-
119
-
120
-
121
-
122
-
123
-
124
-
125
-
126
-
127
-
128
-
129
-
130
-
131
-
132
-
 133
133 -
 134
134 -
 135
135 -
 136
136 -
 137
137 -
 138
138 -
 139
139 -
 140
140 -
 141
141 -
 142
142 -
 143
143 -
 144
144 -
 145
145 -
 146
146 -
 147
147 -
 148
148 -
 149
149
 |
 |

Financial information
Financial information
282
283
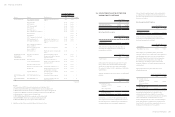
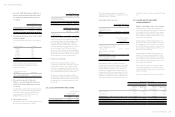
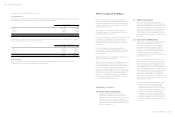
Categories of Financial Instruments
December 31
2015 2014
Financial assets
FVTPL
Held for trading
Loans and receivables (Note 1)
Available-for-sale financial
assets (Note 2)
$ 95,493
61,510,211
3,699,515
$ 262,544
87,417,203
2,586,571
Financial liabilities
FVTPL
Held for trading
Amortized cost (Note 3)
36,544
54,945,520
22,424
76,290,450
Note 1: The balances included loans and receivables measured at amortized
cost, which comprise cash and cash equivalents, debt investments
with no active market - current, other current financial assets, trade
receivables, other receivables and refundable deposits.
Note 2: The balances included available-for-sale financial assets and the
carrying amount of available-for-sale financial assets measured at cost.
Note 3: The balances included financial liabilities measured at amortized cost,
which comprise note and trade payables, other payables, agency receipts
and guarantee deposits received.
Financial Risk Management Objectives and
Policies
The Company's financial instruments mainly include equity
and debt investments, trade receivables, other receivables,
trade payables and other payables. The Company's
Corporate Treasury function provides services to the
business, coordinates access to domestic and international
financial markets, monitors and manages the financial risks
relating to the operations of the Company through internal
risk reports which analyze the exposures by degree and
magnitude of risks. These risks include market risk, credit
risk and liquidity risk.
The Company sought to minimize the effects of these risks
by using derivative financial instruments and non-derivative
financial instruments to hedge risk exposures. The use of
financial derivatives was governed by the Company's policies
approved by the board of directors, which provide written
principles on foreign exchange risk, interest rate risk, credit
risk, the use of financial derivatives and non-derivative
financial instruments, and the investment of excess liquidity.
Compliance with policies and exposure limits was reviewed
by the internal auditors on a continuous basis. The Company
did not enter into or trade financial instruments, including
derivative financial instruments, for speculative purposes.
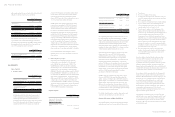
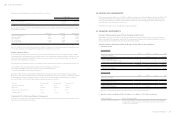
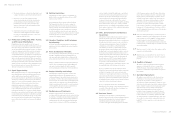
Profit or
Loss (1)
Equity
(2)
For the year ended December 31, 2015
USD
EUR
RMB
JPY
$( 17,990)
( 7,488)
(24,568)
( 932)
$ -
-
-
-
For the year ended December 31, 2014
USD
EUR
RMB
JPY
$ 40,670
( 9,028)
( 35,725)
2,324
$ -
-
-
-
1) This was mainly attributable to the exposure outstanding on each
currency receivables and payables, which were not hedged at the end of
the reporting period.
2) This was mainly as a result of the changes in fair value of derivative
instruments designated as hedging instruments in cash flow hedges.
b. Credit risk
Credit risk refers to the risk that counterparty will
default on its contractual obligations resulting in
financial loss to the Company. As at the end of reporting
period, the Company's maximum exposure to credit risk
which will cause a financial loss to the Company due
to failure of counterparties to discharge an obligation
and financial guarantees provided by the Company
could arise from the carrying amount of the respective
recognized financial assets as stated in the balance
The Corporate Treasury function reports quarterly to
the Company's supervisory and board of directors for
monitoring risks and policies implemented to mitigate risk
exposures.
a. Market risk
The Company's activities exposed it primarily to the
financial risks of changes in foreign currency exchange
rates. The Company entered into a variety of derivative
financial instruments to manage its exposure to foreign
currency risk.
There had been no change to the Company's exposure
to market risks or the manner in which these risks were
managed and measured.
Foreign currency risk
The Company undertook transactions denominated in
foreign currencies; consequently, exposures to exchange
rate fluctuations arose. Exchange rate exposures were
managed within approved policy parameters utilizing
forward foreign exchange contracts.
The carrying amounts of the Company's foreign
currency denominated monetary assets and monetary
liabilities and of the derivatives exposing to foreign
currency risk at the end of the reporting period are set
out in Note 35.
Sensitivity analysis
The Company was mainly exposed to the currency
United Stated dollars (“USD”), currency Euro (“EUR”),
currency Renminbi (“RMB”) and currency Japanese yen
(“JPY”).
The following table details the Company's sensitivity to
a 1% increase and decrease in the New Taiwan dollars
(“NTD”, the functional currency) against the relevant
foreign currencies. The sensitivity analysis included
only outstanding foreign currency denominated
monetary items and foreign currency forward contracts
designated as cash flow hedges. A positive number
below indicates an increase in pre-tax profit (loss) or
equity associated with the NTD strengthens 1% against
the relevant currency. For a 1% weakening of the NTD
against the relevant currency, there would be an equal
and opposite impact on pre-tax profit (loss) or equity,
and the balances below would be negative.
sheets. The Company does not issue any financial
guarantee involving credit risk.
The Company adopted a policy of only dealing with
creditworthy counterparties and obtaining sufficient
collateral, where appropriate, as a means of mitigating
the risk of financial loss from defaults.
The credit risk information of trade receivables are
disclosed in the Note 11.
c. Liquidity risk
The Company manages liquidity risk to ensure that
the Company possesses sufficient financial flexibility
by maintaining adequate reserves of cash and cash
equivalents and reserve financing facilities, and also
monitor liquidity risk of shortage of funds by the
maturity date of financial instruments and financial
assets.
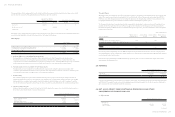
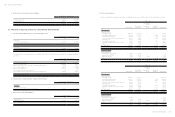
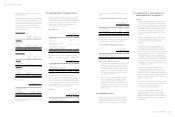
1) Liquidity and interest risk rate tables for non-
derivative financial liabilities
The following table details the Company's remaining
contractual maturity for its non-derivative financial
liabilities with agreed repayment periods. The
tables had been drawn up based on the undiscounted
cash flows of financial liabilities from the earliest
date on which the Company can be required to pay.
December 31, 2015
Less Than 3 Months 3 Months to 1 Year Over 1 Year
Non-derivative financial liabilities
Note and trade payables
Other payables
Other current liabilities
Guarantee deposits received
$ 11,276,426
11,682,250
111,498
-
$18,321,959
13,311,026
212,202
-
$ -
-
-
30,159
$23,070,174 $31,845,187 $30,159
December 31, 2014
Less Than 3 Months 3 Months to 1 Year Over 1 Year
Non-derivative financial liabilities
Note and trade payables
Other payables
Other current liabilities
Guarantee deposits received
$ 14,037,502
12,648,166
60,588
-
$ 29,765,841
19,589,779
145,344
-
$ -
-
-
43,230
$26,746,256 $ 49,500,964 $43,230