HTC 2015 Annual Report Download - page 91
Download and view the complete annual report
Please find page 91 of the 2015 HTC annual report below. You can navigate through the pages in the report by either clicking on the pages listed below, or by using the keyword search tool below to find specific information within the annual report.-
 1
1 -
2
-
3
-
4
-
5
-
6
-
7
-
8
-
9
-
10
-
11
-
12
-
13
-
14
-
15
-
16
-
17
-
18
-
19
-
20
-
21
-
22
-
23
-
24
-
25
-
26
-
27
-
28
-
29
-
30
-
31
-
32
-
33
-
34
-
35
-
36
-
37
-
38
-
39
-
40
-
41
-
42
-
43
-
44
-
45
-
46
-
47
-
48
-
49
-
50
-
51
-
52
-
53
-
54
-
55
-
56
-
57
-
58
-
59
-
60
-
61
-
62
-
63
-
64
-
65
-
66
-
67
-
68
-
69
-
70
-
71
-
72
-
73
-
74
-
75
-
76
-
77
-
78
-
79
-
80
-
 81
81 -
 82
82 -
 83
83 -
 84
84 -
 85
85 -
 86
86 -
 87
87 -
 88
88 -
 89
89 -
 90
90 -
 91
91 -
 92
92 -
 93
93 -
 94
94 -
 95
95 -
 96
96 -
 97
97 -
 98
98 -
 99
99 -
 100
100 -
 101
101 -
102
-
103
-
104
-
105
-
106
-
107
-
108
-
109
-
110
-
111
-
112
-
113
-
114
-
115
-
116
-
117
-
118
-
119
-
120
-
121
-
122
-
123
-
124
-
125
-
126
-
127
-
128
-
129
-
130
-
131
-
132
-
133
-
134
-
135
-
136
-
137
-
138
-
139
-
140
-
141
-
142
-
143
-
144
-
145
-
146
-
147
-
148
-
149
 |
 |

Financial information
Financial information
178
179
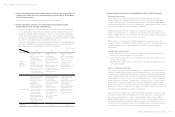
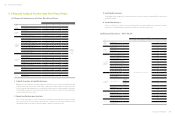
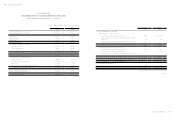
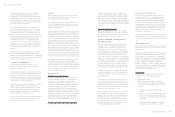
3. Financial Analysis for the Past Five Fiscal Years
(1) Financial Analysis for the Past Five Fiscal Years
Item
Year
2015 2014 2013 2012 2011
Capital
Structure
Analysis
DebtRatio(%) 49 51 54 59
Financial
analysis was
based on ROC
GAAP
Long-termFundtoFixedAssetsRatio(%) 493 431 393 407
Liquidity
Analysis
CurrentRatio(%) 93 103 97 103
QuickRatio(%) 62 80 72 82
DebtServicesCoverageRatio(%) ( 2,145 ) 94 ( 195 ) 52,916
Operating
Performance
Analysis
Average Collection Turnover(Times) 4.81 5.65 5.43 5.02
Days Sales Outstanding 76 65 67 73
AverageInventoryTurnover(Times) 5.68 7.66 7.12 7.85
AveragePaymentTurnover(Times) 2.61 3.65 2.62 2.84
AverageInventoryTurnoverDays 64 48 51 46
Fixed Assets Turnover (Times) 7.36 9.10 9.84 15.45
Total Assets Turnover (Times) 0.81 1.06 1.07 1.22
Profitability
Analysis
ReturnonTotalAssets(%) (10.69) 0.90 ( 0.72 ) 7.57
ReturnonEquity(%) ( 21.41 ) 1.88 (1.68) 18.52
Ratioofincomebeforetaxtopaid-incapital(%) ( 202 ) 18.34 (15.26) 198.73
NetMargin(%) (13.27) 0.85 (0.68) 6.21
BasicEarningsPerShare(NT$) ( 18.79 ) 1.80 (1.60) 20.21
Cash Flow
CashFlowRatio(%) ( 20.87 ) 0.72 (14.76) 19.50
CashFlowAdequacyRatio(%) 94.56 110.33 113.13 128.67
CashFlowReinvestmentRatio(%) ( 17.81 ) 0.65 ( 17.28 ) ( 12.04 )
Leverage
Operating Leverage ( 0.71 ) 37.00 ( 5.87 ) 2.37
Financial Leverage 1 1 1 1
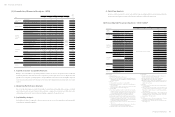
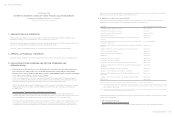
1. Capital Structure & Liquidity Analyses
Owing to net cash outflow for operating activities in 2015, the decrease in current and quick asset has
resulted in decline in current ratio and quick ratio. Debt ratio was lower compared to previous year due
to decrease in purchase and payables for royalty and operating expenses. Long-term funds to fixed asset
ratio was higher compared to previous year given lowered book value for fixed asset after impairment
assessment and strict capex control.
2. Operating Performance Analysis
Due to decline in revenue as a result of intensified competition and weak global economics, our fixed
asset turnover and total asset turnover were all lower compared to previous year, while days sales
outstanding and inventory turnover days were higher compared to the previous year.
3. Profitability Analysis
Profitabilitydeclinedcomparedtothepreviousyearduetoproducttransitionandintensifiedcompetitionin
smartphone market.
4. Cash Flow Analysis
As we recorded a loss in 2015, our net cash outflow from operating activities saw an increase from the
previous year, resulting in negative cash flow ratio and lower cash flow adequacy ratio.
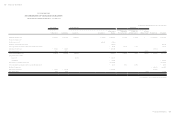
(2) Financial Analysis – ROC GAAP
Item
Year
2015 2014 2013 2012 2011
Capital
Structure
Analysis
DebtRatio(%)
FinancialanalysiswasbasedonIFRS
60 59
Long-termFundtoFixedAssetsRatio(%) 403 658
Liquidity
Analysis
CurrentRatio(%) 103 123
QuickRatio(%) 80 100
DebtServicesCoverageRatio(%) 52,892 6,806
Operating
Performance
Analysis
Average Collection Turnover (Times) 5.02 6.95
Days Sales Outstanding 73 53
AverageInventoryTurnover(Times) 7.85 12.11
AveragePaymentTurnover(Times) 2.78 4.85
AverageInventoryTurnoverDays 46 30
Fixed Assets Turnover (Times) 15.31 34.52
Total Assets Turnover (Times) 1.12 1.94
Profitability
Analysis
ReturnonTotalAssets(%) 8 29
ReturnonEquity(%) 18 70
Paid-inCapitalRatio(%)
Operating
Income 173 761
Pre-tax
Income 199 820
NetMargin(%) 6 14
BasicEarningsPerShare(NT$) 20.17 73.32
Cash Flow
CashFlowRatio(%) 19 58
CashFlowAdequacyRatio(%) 129 163
CashFlowReinvestmentRatio(%) (12) 52
Leverage
Operating Leverage 2.37 1.35
Financial Leverage 1 1