HTC 2015 Annual Report Download - page 131
Download and view the complete annual report
Please find page 131 of the 2015 HTC annual report below. You can navigate through the pages in the report by either clicking on the pages listed below, or by using the keyword search tool below to find specific information within the annual report.-
 1
1 -
2
-
3
-
4
-
5
-
6
-
7
-
8
-
9
-
10
-
11
-
12
-
13
-
14
-
15
-
16
-
17
-
18
-
19
-
20
-
21
-
22
-
23
-
24
-
25
-
26
-
27
-
28
-
29
-
30
-
31
-
32
-
33
-
34
-
35
-
36
-
37
-
38
-
39
-
40
-
41
-
42
-
43
-
44
-
45
-
46
-
47
-
48
-
49
-
50
-
51
-
52
-
53
-
54
-
55
-
56
-
57
-
58
-
59
-
60
-
61
-
62
-
63
-
64
-
65
-
66
-
67
-
68
-
69
-
70
-
71
-
72
-
73
-
74
-
75
-
76
-
77
-
78
-
79
-
80
-
81
-
82
-
83
-
84
-
85
-
86
-
87
-
88
-
89
-
90
-
91
-
92
-
93
-
94
-
95
-
96
-
97
-
98
-
99
-
100
-
101
-
102
-
103
-
104
-
105
-
106
-
107
-
108
-
109
-
110
-
111
-
112
-
113
-
114
-
115
-
116
-
117
-
118
-
119
-
120
-
 121
121 -
 122
122 -
 123
123 -
 124
124 -
 125
125 -
 126
126 -
 127
127 -
 128
128 -
 129
129 -
 130
130 -
 131
131 -
 132
132 -
 133
133 -
 134
134 -
 135
135 -
 136
136 -
 137
137 -
 138
138 -
 139
139 -
 140
140 -
 141
141 -
142
-
143
-
144
-
145
-
146
-
147
-
148
-
149
 |
 |

Financial information
Financial information
258
259
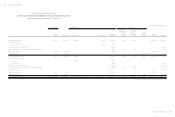
For the Year Ended
December 31
2015 2014
Revenues
Other gains and losses
$22,604
1,258
$102,057
1,939
$ 23,862 $103,996
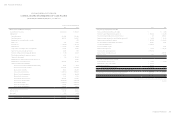
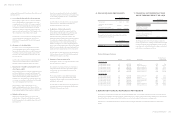
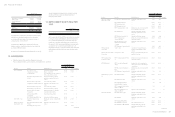
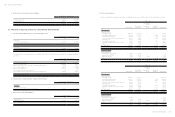
9. FINANCIAL ASSETS MEASURED AT
COST
December 31
2015 2014
Domestic unlisted equity investment
Overseas unlisted equity investment
Overseas unlisted mutual funds
$ 643,961
2,054,310
697,880
$ 643,961
1,423,818
518,699
$ 3,396,151 $2,586,478
Classified according to financial asset
measurement categories
Available-for-sale financial assets $ 3,396,151 $2,586,478
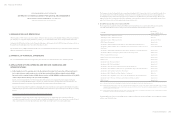
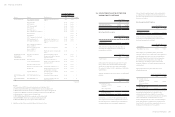
Management believed that the above unlisted equity
investments and mutual funds held by the Company, whose
fair value cannot be reliably measured due to the range of
reasonable fair value estimates was so significant; therefore,
they were measured at cost less impairment at the end of
reporting period.
The Company disposed of the investments in Primavera
Capital (Cayman) Fund L.L.P. and Shanghai F-road
Commercial Co., Ltd. in May 2014. Furthermore, the
Company made a partial disposal of shares of KKBOX Inc. in
August 2014. These transactions resulted in the recognition of
a gain in profit or loss, calculated as follows:
Proceeds of disposal $ 2,358,135
Less: Carrying amount of investment
on the date of disposal (2,200,140)
Gain recognized $ 157,995
In 2014, the Company determined that the recoverable
amount of financial assets measured at cost was less than its
carrying amount and thus recognized an impairment loss of
$373,257 thousand.
10. OTHER CURRENT FINANCIAL
ASSETS
December 31
2015 2014
Time deposits with original
maturities more than three months $4,100,290 $334,954
The market rate intervals of time deposits with original
maturities more than three months at the end of the
reporting period were as follows:
December 31
2015 2014
Time deposits with original
maturities more than three months 0.51%-1.95% 0.30%-3.08%
For details of pledged other current financial assets, please
refer to Note 33.
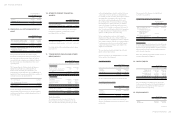
11. TRADE RECEIVABLES AND OTHER
RECEIVABLES
December 31
2015 2014
Trade receivables
Trade receivables
Trade receivables - related parties
Less: Allowances for impairment
loss
$ 21,534,175
1,687
( 3,016,914)
$ 32,194,141
925
( 3,054,782)
$ 18,518,948 $ 29,140,284
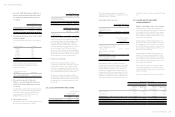
Other receivables
Receivables from disposal of
investments
VAT refund receivables
Interest receivables
Others
$ 1,305,943
273,024
188,431
188,168
$ 1,251,073
246,900
102,771
327,005
$ 1,955,566 $ 1,927,749
Current - other receivables $ 466,791 $ 584,936
Non-current - other receivables 1,488,775 1,342,813
$ 1,955,566 $ 1,927,749
Trade Receivables
The credit period on sales of goods is 30-75 days. No
interest is charged on trade receivables before the due
date. Thereafter, interest is charged at 1-18% per annum
The movements of the allowance for doubtful trade
receivables were as follows:
Movement in the allowances for impairment loss
For the Year Ended
December 31
2015 2014
Balance, beginning of the year
Add: Impairment losses
recognized on receivables
Less: Amounts written off
during the year as
uncollectible
Add: Effect of foreign currency
exchange differences
$ 3,054,782
-
( 38,038)
170
$3,050,907
3,875
-
-
Balance, end of the year $ 3,016,914 $3,054,782
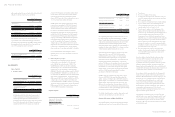
Other Receivables
Receivable from disposal of investments is derived from sale
of shares of Saffron Media Group Ltd. in 2013. According to
the agreement, the principle and interest will be received in
full in September 2018 and could be repaid by the buyer in
whole or in part, at any time.
Others were primarily prepayments on behalf of vendors or
customers and grants from suppliers.
12. INVENTORIES
December 31
2015 2014
Finished goods
Work-in-process
Semi-finished goods
Raw materials
Inventory in transit
$ 4,060,279
460,282
3,073,114
10,930,317
599,645
$ 2,925,203
686,398
3,692,029
9,491,854
417,576
$19,123,637 $17,213,060
The cost of inventories recognized as cost of goods sold
for the year ended December 31, 2015 and 2014 included
inventory write-downs of NT$1,939,446 thousand and
NT$521,692 thousand, respectively.
13. PREPAYMENTS
December 31
2015 2014
Royalty
Net input VAT
$6,978,900
1,082,836
$12,068,674
1,848,355
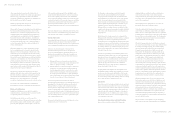
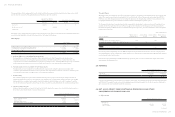
on the outstanding balance, which is considered to be non-
controversial, to some of customers. In determining the
recoverability of a trade receivable, the Company considered
any change in the credit quality of the trade receivable
since the date credit was initially granted to the end of
the reporting period. For customers with low credit risk,
the Company has recognized an allowance for doubtful
debts of 1-5% against receivables past due beyond 31-90
days and of 5-100% against receivables past due beyond 91
days. For customers with high credit risk, the Company has
recognized an allowance for impairment loss of 10-100%
against receivables past due more than 31 days.
Before accepting any new customer, the Company's
Department of Financial and Accounting evaluates the
potential customer's credit quality and defines credit limits
and scorings by customer. The factor of overdue attributed
to customers are reviewed once a week and the Company
evaluates the financial performance periodically for the
adjustment of credit limits.
The concentration of credit risk is limited due to the fact
that the customer base is diverse.
As of the reporting date, the Company had no receivables
that are past due but not impaired.
Age of trade receivables
December 31
2015 2014
1-90 days
91-180 days
Over 181 days
$ 1,129,769
95,996
2,840,451
$3,322,048
36,184
2,642,973
$4,066,216 $6,001,205
The above aging schedule was based on the past due date.
Age of impaired trade receivables
December 31
2015 2014
1-90 days
91-180 days
Over 181 days
$1,049,302
-
-
$2,946,423
-
-
$1,049,302 $2,946,423
The above aging of trade receivables after deducting the
allowance for impairment loss were presented based on the
past due date.
(Continued)