HTC 2015 Annual Report Download - page 116
Download and view the complete annual report
Please find page 116 of the 2015 HTC annual report below. You can navigate through the pages in the report by either clicking on the pages listed below, or by using the keyword search tool below to find specific information within the annual report.-
 1
1 -
2
-
3
-
4
-
5
-
6
-
7
-
8
-
9
-
10
-
11
-
12
-
13
-
14
-
15
-
16
-
17
-
18
-
19
-
20
-
21
-
22
-
23
-
24
-
25
-
26
-
27
-
28
-
29
-
30
-
31
-
32
-
33
-
34
-
35
-
36
-
37
-
38
-
39
-
40
-
41
-
42
-
43
-
44
-
45
-
46
-
47
-
48
-
49
-
50
-
51
-
52
-
53
-
54
-
55
-
56
-
57
-
58
-
59
-
60
-
61
-
62
-
63
-
64
-
65
-
66
-
67
-
68
-
69
-
70
-
71
-
72
-
73
-
74
-
75
-
76
-
77
-
78
-
79
-
80
-
81
-
82
-
83
-
84
-
85
-
86
-
87
-
88
-
89
-
90
-
91
-
92
-
93
-
94
-
95
-
96
-
97
-
98
-
99
-
100
-
101
-
102
-
103
-
104
-
105
-
 106
106 -
 107
107 -
 108
108 -
 109
109 -
 110
110 -
 111
111 -
 112
112 -
 113
113 -
 114
114 -
 115
115 -
 116
116 -
 117
117 -
 118
118 -
 119
119 -
 120
120 -
 121
121 -
 122
122 -
 123
123 -
 124
124 -
 125
125 -
 126
126 -
127
-
128
-
129
-
130
-
131
-
132
-
133
-
134
-
135
-
136
-
137
-
138
-
139
-
140
-
141
-
142
-
143
-
144
-
145
-
146
-
147
-
148
-
149
 |
 |

Financial information
Financial information
228
229
The Company adopted a policy of only dealing with creditworthy counterparties and obtaining sufficient collateral, where
appropriate, as a means of mitigating the risk of financial loss from defaults.
The credit risk information of trade receivables are disclosed in the Note 10.
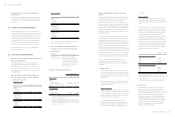
c. Liquidity risk
The Company manages liquidity risk to ensure that the Company possesses sufficient financial flexibility by maintaining adequate
reserves of cash and cash equivalents and reserve financing facilities, and also monitor liquidity risk of shortage of funds by the
maturity date of financial instruments and financial assets.
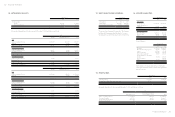
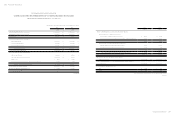
1) Liquidity and interest risk rate tables for non-derivative financial liabilities
The following table details the Company's remaining contractual maturity for its non-derivative financial liabilities with agreed
repayment periods. The tables had been drawn up based on the undiscounted cash flows of financial liabilities from the earliest
date on which the Company can be required to pay.
December 31, 2015
Less Than 3 Months 3 to 12 Months Over 1 Year
Non-derivative financial liabilities
Note and trade payables
Other payables
Other current liabilities
Guarantee deposits received
$ 11,642,922
11,279,562
111,498
-
$18,396,537
12,827,054
145,205
-
$ -
-
-
1,634
$23,033,982 $31,368,796 $1,634
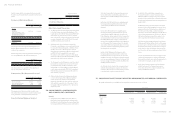
December 31, 2014
Less Than 3 Months 3 to 12 Months Over 1 Year
Non-derivative financial liabilities
Note and trade payables
Other payables
Other current liabilities
Guarantee deposits received
$ 19,389,742
10,952,324
60,588
-
$27,934,589
18,293,729
72,984
-
$ -
-
-
1,160
$30,402,654 $46,301,302 $1,160
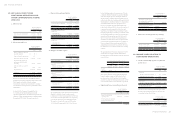
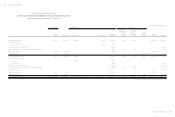
2) Liquidity and interest risk rate tables for derivative financial instruments
The following table detailed the Company's liquidity analysis for its derivative financial instruments. The table was based
on the undiscounted contractual net cash inflows and outflows on derivative instruments that settle on a net basis, and the
undiscounted gross inflows and outflows on those derivatives that require gross settlement.
December 31, 2015
Less Than3 Months 3 Months to 1 Year Over 1 Year
Gross settled
Foreign exchange contracts
Inflows
Outflows
$ 6,658,903
( 6,611,069)
$ 7,187,186
(7,158,069)
$ -
-
$ 47,834 $ 29,117 $ -
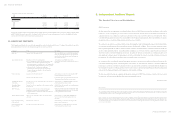
December 31, 2014
Less Than3 Months 3 Months to 1 Year Over 1 Year
Net settled
Foreign exchange contracts $ 15,600 $ - $ -
Gross settled
Foreign exchange contracts
Inflows
Outflows
$ 13,853,499
(13,630,802)
$ -
-
$ -
-
$ 222,697 $ - $ -
(Concluded)
3) Bank credit limit
December 31
2015 2014
Unsecured bank general credit limit
Amount used
Amount unused
$ 2,053,485
30,314,067
$ 1,638,476
43,623,999
$32,367,552 $45,262,475
Amount used includes guarantee for customs duties and for patent litigation.
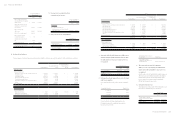
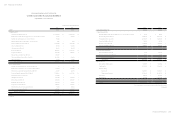
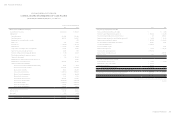
29. RELATED-PARTY TRANSACTIONS
Operating Sales
For the Year Ended December 31
2015 2014
Subsidiaries
Joint venture
Main management
Other related parties - Employees' Welfare Committee
Other related parties - other related parties' chairperson or its significant stockholder, is the
Company's chairperson
$35,572,044
9,971
-
20,920
6,302
$ 58,666,162
-
2,430
22,404
7,513
$35,609,237 $58,698,509
The following balances of trade receivables from related parties were outstanding at the end of the reporting period:
December 31
2015 2014
Subsidiaries
Joint venture
Other related parties - other related parties' chairperson or its significant stockholder, is the
Company's chairperson
$7,953,665
541
1,146
$16,249,309
-
925
$7,955,352 $16,250,234
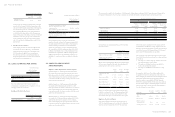
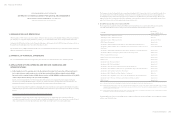
The selling prices for products sold to related parties were lower than those sold to third parties, except some related parties have no
comparison with those sold to third parties. No guarantees had been given or received for trade receivables from related parties. No
(Continued)