HTC 2015 Annual Report Download - page 108
Download and view the complete annual report
Please find page 108 of the 2015 HTC annual report below. You can navigate through the pages in the report by either clicking on the pages listed below, or by using the keyword search tool below to find specific information within the annual report.-
 1
1 -
2
-
3
-
4
-
5
-
6
-
7
-
8
-
9
-
10
-
11
-
12
-
13
-
14
-
15
-
16
-
17
-
18
-
19
-
20
-
21
-
22
-
23
-
24
-
25
-
26
-
27
-
28
-
29
-
30
-
31
-
32
-
33
-
34
-
35
-
36
-
37
-
38
-
39
-
40
-
41
-
42
-
43
-
44
-
45
-
46
-
47
-
48
-
49
-
50
-
51
-
52
-
53
-
54
-
55
-
56
-
57
-
58
-
59
-
60
-
61
-
62
-
63
-
64
-
65
-
66
-
67
-
68
-
69
-
70
-
71
-
72
-
73
-
74
-
75
-
76
-
77
-
78
-
79
-
80
-
81
-
82
-
83
-
84
-
85
-
86
-
87
-
88
-
89
-
90
-
91
-
92
-
93
-
94
-
95
-
96
-
97
-
 98
98 -
 99
99 -
 100
100 -
 101
101 -
 102
102 -
 103
103 -
 104
104 -
 105
105 -
 106
106 -
 107
107 -
 108
108 -
 109
109 -
 110
110 -
 111
111 -
 112
112 -
 113
113 -
 114
114 -
 115
115 -
 116
116 -
 117
117 -
 118
118 -
119
-
120
-
121
-
122
-
123
-
124
-
125
-
126
-
127
-
128
-
129
-
130
-
131
-
132
-
133
-
134
-
135
-
136
-
137
-
138
-
139
-
140
-
141
-
142
-
143
-
144
-
145
-
146
-
147
-
148
-
149
 |
 |

Financial information
Financial information
212
213
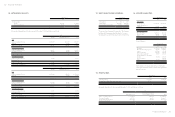
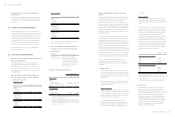
16. INTANGIBLE ASSETS
December 31
2015 2014
Carrying amounts
Patents
Other intangible assets
$ 130,941
491,197
$ 579,118
643,603
$622,138 $1,222,721
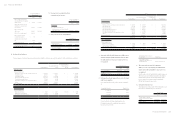
Movements of intangible assets for the years ended December 31, 2015 and 2014 were as follows:
2015
Patents Other Intangible Assets Total
Cost
Balance, beginning of the year
Additions
$2,516,290
-
$1,043,867
81,970
$ 3,560,157
81,970
Balance, end of the year 2,516,290 1,125,837 3,642,127
Accumulated amortization
Balance, beginning of the year
Amortization expenses
1,826,087
448,177
400,264
234,376
2,226,351
682,553
Balance, end of the year 2,274,264 634,640 2,908,904
Accumulated impairment
Balance, beginning of the year
Impairment losses
111,085
-
-
-
111,085
-
Balance, end of the year 111,085 - 111,085
Net book value, end of the year $ 130,941 $ 491,197 $ 622,138
2014
Patents Other Intangible Assets Total
Cost
Balance, beginning of the year
Additions
$2,516,290
-
$ 822,150
221,717
$ 3,338,440
221,717
Balance, end of the year 2,516,290 1,043,867 3,560,157
Accumulated amortization
Balance, beginning of the year
Amortization expenses
1,377,910
448,177
198,554
201,710
1,576,464
649,887
Balance, end of the year 1,826,087 400,264 2,226,351
Accumulated impairment
Balance, beginning of the year
Impairment losses
111,085
-
-
-
111,085
-
Balance, end of the year 111,085 - 111,085
Net book value, end of the year $ 579,118 $ 643,603 $1,222,721
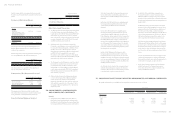
17. NOTE AND TRADE PAYABLES
December 31
2015 2014
Note payables
Trade payables
Trade payables - related parties
$ 555
29,653,990
384,914
$ 1,073
40,814,737
6,508,521
$30,039,459 $47,324,331
The average term of payment is four months. The Company
has financial risk management policies in place to ensure
that all payables are paid within the pre-agreed credit terms.
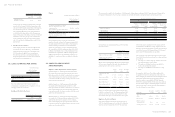
18. OTHER LIABILITIES
December 31
2015 2014
Other payables
Accrued expenses
Payables for purchase of
equipment
$23,979,056
127,560
$29,058,640
187,413
$ 24,106,616 $ 29,246,053
Other current liabilities
Advance receipts
Agency receipts
Others
$2,588,745
256,703
172,251
$234,242
133,572
141,317
$ 3,017,699 $ 509,131
Accrued Expenses
December 31
2015 2014
Marketing
Materials and molding expenses
Services
Salaries and bonuses
Import, export and freight
Repairs, maintenance and sundry
purchase
Bonus to employees
Others
$ 13,520,221
3,161,987
2,857,840
2,801,892
773,676
155,994
-
707,446
$ 17,040,517
2,784,153
3,151,186
3,517,402
686,259
254,254
654,620
970,249
$23,979,056 $29,058,640
The Company accrued marketing expenses on the basis of
related agreements and other factors that would significantly
affect the accruals.
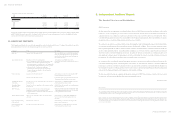
19. PROVISIONS
December 31
2015 2014
Warranty provision
Provisions for contingent loss on purchase orders
$4,773,914
677,893
$ 4,809,312
633,068
$5,451,807 $5,442,380
Movement of provisions for the years ended December 31, 2015 and 2014 were as follows:
2015
Warranty Provision
Provisions for Contingent
Loss on Purchase Orders Total
Balance, beginning of the year
Provisions recognized
Amount utilized during the year
Translation adjustment
$ 4,809,312
10,857,654
(10,893,350)
298
$ 633,068
228,813
(183,988)
-
$ 5,442,380
11,086,467
(11,077,338)
298
Balance, end of the year $ 4,773,914 $ 677,893 $ 5,451,807