HTC 2015 Annual Report Download - page 135
Download and view the complete annual report
Please find page 135 of the 2015 HTC annual report below. You can navigate through the pages in the report by either clicking on the pages listed below, or by using the keyword search tool below to find specific information within the annual report.-
 1
1 -
2
-
3
-
4
-
5
-
6
-
7
-
8
-
9
-
10
-
11
-
12
-
13
-
14
-
15
-
16
-
17
-
18
-
19
-
20
-
21
-
22
-
23
-
24
-
25
-
26
-
27
-
28
-
29
-
30
-
31
-
32
-
33
-
34
-
35
-
36
-
37
-
38
-
39
-
40
-
41
-
42
-
43
-
44
-
45
-
46
-
47
-
48
-
49
-
50
-
51
-
52
-
53
-
54
-
55
-
56
-
57
-
58
-
59
-
60
-
61
-
62
-
63
-
64
-
65
-
66
-
67
-
68
-
69
-
70
-
71
-
72
-
73
-
74
-
75
-
76
-
77
-
78
-
79
-
80
-
81
-
82
-
83
-
84
-
85
-
86
-
87
-
88
-
89
-
90
-
91
-
92
-
93
-
94
-
95
-
96
-
97
-
98
-
99
-
100
-
101
-
102
-
103
-
104
-
105
-
106
-
107
-
108
-
109
-
110
-
111
-
112
-
113
-
114
-
115
-
116
-
117
-
118
-
119
-
120
-
121
-
122
-
123
-
124
-
 125
125 -
 126
126 -
 127
127 -
 128
128 -
 129
129 -
 130
130 -
 131
131 -
 132
132 -
 133
133 -
 134
134 -
 135
135 -
 136
136 -
 137
137 -
 138
138 -
 139
139 -
 140
140 -
 141
141 -
 142
142 -
 143
143 -
 144
144 -
 145
145 -
146
-
147
-
148
-
149
 |
 |

Financial information
Financial information
266
267
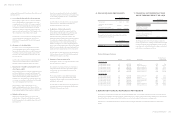
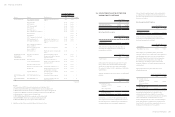
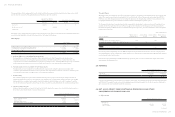
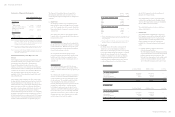
Movements of intangible assets for the years ended December 31, 2015 and 2014 were as follows:
2015
Patents Goodwill
Other Intangible
Assets Total
Cost
Balance, beginning of the year
Additions
Disposals
Disposal of a subsidiary
Effect of foreign currency exchange differences
$12,018,040
-
-
-
416,850
$ 887,037
-
-
(194,964)
5,130
$ 1,951,324
93,683
( 55,472)
( 208,345)
4,347
$ 14,856,401
93,683
( 55,472)
( 403,309)
426,327
Balance, end of the year 12,434,890 697,203 1,785,537 14,917,630
Accumulated amortization
Balance, beginning of the year
Amortization expenses
Disposals
Disposal of a subsidiary
Effect of foreign currency exchange differences
5,488,220
1,644,507
-
-
204,156
-
-
-
-
-
988,470
312,026
( 55,472)
( 208,345)
( 5,521)
6,476,690
1,956,533
( 55,472)
( 208,345)
198,635
Balance, end of the year 7,336,883 - 1,031,158 8,368,041
Accumulated impairment
Balance, beginning of the year
Disposal of a subsidiary
Effect of foreign currency exchange differences
111,085
-
-
887,037
(194,964)
5,130
172,298
-
7,559
1,170,420
( 194,964)
12,689
Balance, end of the year 111,085 697,203 179,857 988,145
Net book value, end of the year $ 4,986,922 $ - $ 574,522 $ 5,561,444
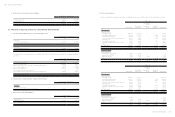
2014
Patents Goodwill
Other Intangible
Assets Total
Cost
Balance, beginning of the year
Additions
Effect of foreign currency exchange differences
$ 11,496,490
-
521,550
$ 874,784
-
12,253
$ 1,689,432
244,588
17,304
$ 14,060,706
244,588
551,107
Balance, end of the year 12,018,040 887,037 1,951,324 14,856,401
Accumulated amortization
Balance, beginning of the year
Amortization expenses
Effect of foreign currency exchange differences
$ 3,716,504
1,586,745
184,971
$ -
-
-
$ 705,679
282,072
719
$ 4,422,183
1,868,817
185,690
Balance, end of the year 5,488,220 - 988,470 6,476,690
Accumulated impairment
Balance, beginning of the year
Impairment losses
Effect of foreign currency exchange differences
111,085
-
-
700,531
174,253
12,253
162,841
-
9,457
974,457
174,253
21,710
Balance, end of the year 111,085 887,037 172,298 1,170,420
Net book value, end of the year $ 6,418,735 $ - $ 790,556 $ 7,209,291
The Company owns patents of graphics technologies. As of December 31, 2015 and 2014, the carrying amounts of such patents were
NT$4,855,981 thousand and NT$5,839,617 thousand, respectively. The patents will be fully amortized over their remaining economic
lives.
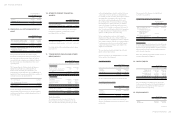
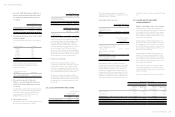
20. NOTE AND TRADE PAYABLES
December 31
2015 2014
Note payables
Trade payables
$ 555
29,597,830
$ 1,541
43,801,802
$29,598,385 $43,803,343
The average term of payment is four months. The Company
has financial risk management policies in place to ensure
that all payables are paid within the pre-agreed credit terms.
21. OTHER LIABILITIES
December 31
2015 2014
Other payables
Accrued expenses
Payables for purchase of
equipment
$ 24,829,310
163,966
$ 31,937,918
300,027
$24,993,276 $32,237,945
Other current liabilities
Advance receipts
Agency receipts
Others
$ 3,173,548
323,700
192,515
$ 773,813
205,932
163,389
$ 3,689,763 $ 1,143,134
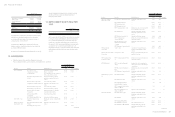
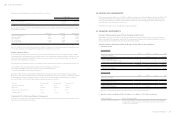
Accrued Expenses
December 31
2015 2014
Marketing
Salaries and bonuses
Materials and molding expenses
Services
Import, export and freight
Repairs, maintenance and sundry
purchase
Bonus to employees
Others
$ 15,124,052
3,344,721
3,162,071
1,188,218
781,548
131,479
-
1,097,221
$20,168,664
4,584,604
2,784,237
1,469,689
728,217
239,048
654,620
1,308,839
$24,829,310 $ 31,937,918
The Company accrued marketing expenses on the basis of
related agreements and other factors that would significantly
affect the accruals.
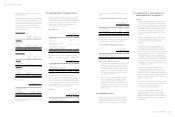
22. PROVISIONS
December 31
2015 2014
Warranty provision
Provisions for contingent loss on
purchase orders
$ 5,314,365
677,893
$ 5,208,111
633,068
$5,992,258 $ 5,841,179
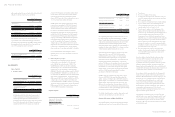
Movement of provisions for the years ended December 31,
2015 and 2014 were as follows:
2015
Warranty
Provision
Provisions
for
Contingent
Loss on
Purchase
Orders Total
Balance, beginning
of the year $ 5,208,111 $ 633,068 $ 5,841,179
Provisions
recognized 11,961,831 228,813 12,190,644
Usage (11,894,207) (183,988) (12,078,195)
Effect of foreign
currency exchange
differences 38,630 - 38,630
Balance, end of the
year $ 5,314,365 $ 677,893 $ 5,992,258
2014
Warranty
Provision
Provisions
for
Contingent
Loss on
Purchase
Orders Total
Balance, beginning
of the year $ 7,376,035 $ 832,850 $ 8,208,885
Provisions
recognized
(reversed)
17,213,295 ( 33,368) 17,179,927
Usage (19,506,904) ( 166,414) (19,673,318)
Effect of foreign
currency exchange
differences 125,685 - 125,685
Balance, end of the
year
$ 5,208,111 $ 633,068 $ 5,841,179