GNC 2012 Annual Report Download - page 94
Download and view the complete annual report
Please find page 94 of the 2012 GNC annual report below. You can navigate through the pages in the report by either clicking on the pages listed below, or by using the keyword search tool below to find specific information within the annual report.-
 1
1 -
2
-
3
-
4
-
5
-
6
-
7
-
8
-
9
-
10
-
11
-
12
-
13
-
14
-
15
-
16
-
17
-
18
-
19
-
20
-
21
-
22
-
23
-
24
-
25
-
26
-
27
-
28
-
29
-
30
-
31
-
32
-
33
-
34
-
35
-
36
-
37
-
38
-
39
-
40
-
41
-
42
-
43
-
44
-
45
-
46
-
47
-
48
-
49
-
50
-
51
-
52
-
53
-
54
-
55
-
56
-
57
-
58
-
59
-
60
-
61
-
62
-
63
-
64
-
65
-
66
-
67
-
68
-
69
-
70
-
71
-
72
-
73
-
74
-
75
-
76
-
77
-
78
-
79
-
80
-
81
-
82
-
83
-
 84
84 -
 85
85 -
 86
86 -
 87
87 -
 88
88 -
 89
89 -
 90
90 -
 91
91 -
 92
92 -
 93
93 -
 94
94 -
 95
95 -
 96
96 -
 97
97 -
 98
98 -
 99
99 -
 100
100 -
 101
101 -
 102
102 -
 103
103 -
 104
104 -
105
-
106
-
107
-
108
-
109
-
110
-
111
-
112
-
113
-
114
-
115
-
116
-
117
-
118
-
119
-
120
-
121
-
122
-
123
-
124
-
125
-
126
-
127
-
128
-
129
-
130
-
131
-
132
-
133
-
134
-
135
-
136
-
137
-
138
-
139
-
140
-
141
-
142
-
143
-
144
-
145
 |
 |

Table of Contents
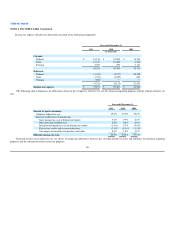
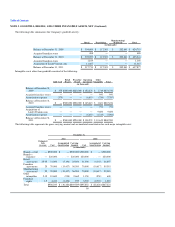
NOTE 5. GOODWILL, BRANDS, AND OTHER INTANGIBLE ASSETS, NET (Continued)
The following table summarizes the Company's goodwill activity:
Retail Franchising Manufacturing/
Wholesale Total
(in thousands)
Balance at December 31. 2009 $ 304,609 $ 117,303 $ 202,841 $ 624,753
Acquired franchise stores 488 — — 488
Balance at December 31, 2010 $ 305,097 $ 117,303 $ 202,841 $ 625,241
Acquired franchise stores 1,169 — — 1,169
Acquisition of LuckyVitamin.com 11,467 — — 11,467
Balance at December 31, 2011 $ 317,733 $ 117,303 $ 202,841 $ 637,877
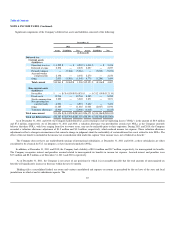
Intangible assets other than goodwill consisted of the following:
Gold Card Retail
Brand Franchise
Brand Operating
Agreements Other
Intangibles Total
(in thousands)
Balance at December 31,
2009 $ 375 $500,000 $220,000 $ 152,276 $ 1,719 $874,370
Acquired franchise stores — — — — 641 641
Amortization expense (375) — — (6,653) (759) (7,787)
Balance at December 31,
2010 $ — $500,000 $220,000 $ 145,623 $ 1,601 $867,224
Acquired franchise stores — — — — 731 731
Acquisition of
LuckyVitamin.com — — — — 9,600 9,600
Amortization expense — — — (6,653) (1,313) (7,966)
Balance at December 31,
2011 $ — $500,000 $220,000 $ 138,970 $ 10,619 $869,589
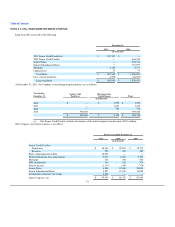
The following table represents the gross carrying amount and accumulated amortization for each major intangible asset:
December 31,
2011 2010
Estimated
Life
in years Cost Accumulated
Amortization Carrying
Amount Cost Accumulated
Amortization Carrying
Amount
(in thousands)
Brands—retail — $500,000 $ — $500,000 $500,000 $ — $500,000
Brands—
franchise — 220,000 — 220,000 220,000 — 220,000
Retail
agreements 25-35 31,000 (5,196) 25,804 31,000 (4,143) 26,857
Franchise
agreements 25 70,000 (13,417) 56,583 70,000 (10,617) 59,383
Manufacturing
agreements 25 70,000 (13,417) 56,583 70,000 (10,617) 59,383
Other
intangibles 5-15 10,600 (938) 9,662 1,150 (550) 600
Franchise
rights 1-5 4,433 (3,476) 957 3,702 (2,701) 1,001
Total $906,033 $ (36,444)$869,589 $895,852 $ (28,628)$867,224
89