GNC 2012 Annual Report Download - page 79
Download and view the complete annual report
Please find page 79 of the 2012 GNC annual report below. You can navigate through the pages in the report by either clicking on the pages listed below, or by using the keyword search tool below to find specific information within the annual report.-
 1
1 -
2
-
3
-
4
-
5
-
6
-
7
-
8
-
9
-
10
-
11
-
12
-
13
-
14
-
15
-
16
-
17
-
18
-
19
-
20
-
21
-
22
-
23
-
24
-
25
-
26
-
27
-
28
-
29
-
30
-
31
-
32
-
33
-
34
-
35
-
36
-
37
-
38
-
39
-
40
-
41
-
42
-
43
-
44
-
45
-
46
-
47
-
48
-
49
-
50
-
51
-
52
-
53
-
54
-
55
-
56
-
57
-
58
-
59
-
60
-
61
-
62
-
63
-
64
-
65
-
66
-
67
-
68
-
 69
69 -
 70
70 -
 71
71 -
 72
72 -
 73
73 -
 74
74 -
 75
75 -
 76
76 -
 77
77 -
 78
78 -
 79
79 -
 80
80 -
 81
81 -
 82
82 -
 83
83 -
 84
84 -
 85
85 -
 86
86 -
 87
87 -
 88
88 -
 89
89 -
90
-
91
-
92
-
93
-
94
-
95
-
96
-
97
-
98
-
99
-
100
-
101
-
102
-
103
-
104
-
105
-
106
-
107
-
108
-
109
-
110
-
111
-
112
-
113
-
114
-
115
-
116
-
117
-
118
-
119
-
120
-
121
-
122
-
123
-
124
-
125
-
126
-
127
-
128
-
129
-
130
-
131
-
132
-
133
-
134
-
135
-
136
-
137
-
138
-
139
-
140
-
141
-
142
-
143
-
144
-
145
 |
 |

Table of Contents
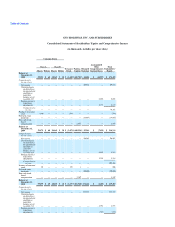
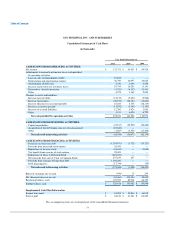
GNC HOLDINGS, INC. AND SUBSIDIARIES
Consolidated Statements of Income
(in thousands, except per share data)
Year ended December 31,
2011 2010 2009
Revenue $ 2,072,179 $ 1,822,168 $ 1,707,007
Cost of sales, including cost of warehousing,
distribution and occupancy 1,318,346 1,179,886 1,116,437
Gross profit 753,833 642,282 590,570
Compensation and related benefits 291,268 273,797 263,046
Advertising and promotion 52,924 51,707 50,034
Other selling, general and administrative 113,477 100,687 96,619
Foreign currency loss (gain) 121 (296) (155)
Transaction and strategic alternative related costs 13,536 3,981 —
Operating income 282,507 212,406 181,026
Interest expense, net (Note 8) 74,903 65,376 69,940
Income before income taxes 207,604 147,030 111,086
Income tax expense (Note 4) 75,271 50,463 41,562
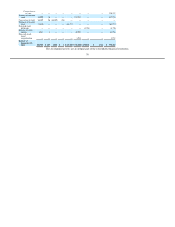
Net income $ 132,333 $ 96,567 $ 69,524
Income per share—Basic and Diluted:
Net income $ 132,333 $ 96,567 $ 69,524
Preferred stock dividends (4,726) (20,606) (18,667)
Net income available to common shareholders $ 127,607 $ 75,961 $ 50,857
Earnings per share:
Basic $ 1.27 $ 0.87 $ 0.58
Diluted $ 1.24 $ 0.85 $ 0.58
Weighted average common shares outstanding:
Basic 100,261 87,339 87,421
Diluted 103,010 88,917 87,859
The accompanying notes are an integral part of the consolidated financial statements.
75