GNC 2012 Annual Report Download - page 10
Download and view the complete annual report
Please find page 10 of the 2012 GNC annual report below. You can navigate through the pages in the report by either clicking on the pages listed below, or by using the keyword search tool below to find specific information within the annual report.-
 1
1 -
 2
2 -
 3
3 -
 4
4 -
 5
5 -
 6
6 -
 7
7 -
 8
8 -
 9
9 -
 10
10 -
 11
11 -
 12
12 -
 13
13 -
 14
14 -
 15
15 -
 16
16 -
 17
17 -
 18
18 -
 19
19 -
 20
20 -
 21
21 -
22
-
23
-
24
-
25
-
26
-
27
-
28
-
29
-
30
-
31
-
32
-
33
-
34
-
35
-
36
-
37
-
38
-
39
-
40
-
41
-
42
-
43
-
44
-
45
-
46
-
47
-
48
-
49
-
50
-
51
-
52
-
53
-
54
-
55
-
56
-
57
-
58
-
59
-
60
-
61
-
62
-
63
-
64
-
65
-
66
-
67
-
68
-
69
-
70
-
71
-
72
-
73
-
74
-
75
-
76
-
77
-
78
-
79
-
80
-
81
-
82
-
83
-
84
-
85
-
86
-
87
-
88
-
89
-
90
-
91
-
92
-
93
-
94
-
95
-
96
-
97
-
98
-
99
-
100
-
101
-
102
-
103
-
104
-
105
-
106
-
107
-
108
-
109
-
110
-
111
-
112
-
113
-
114
-
115
-
116
-
117
-
118
-
119
-
120
-
121
-
122
-
123
-
124
-
125
-
126
-
127
-
128
-
129
-
130
-
131
-
132
-
133
-
134
-
135
-
136
-
137
-
138
-
139
-
140
-
141
-
142
-
143
-
144
-
145
 |
 |
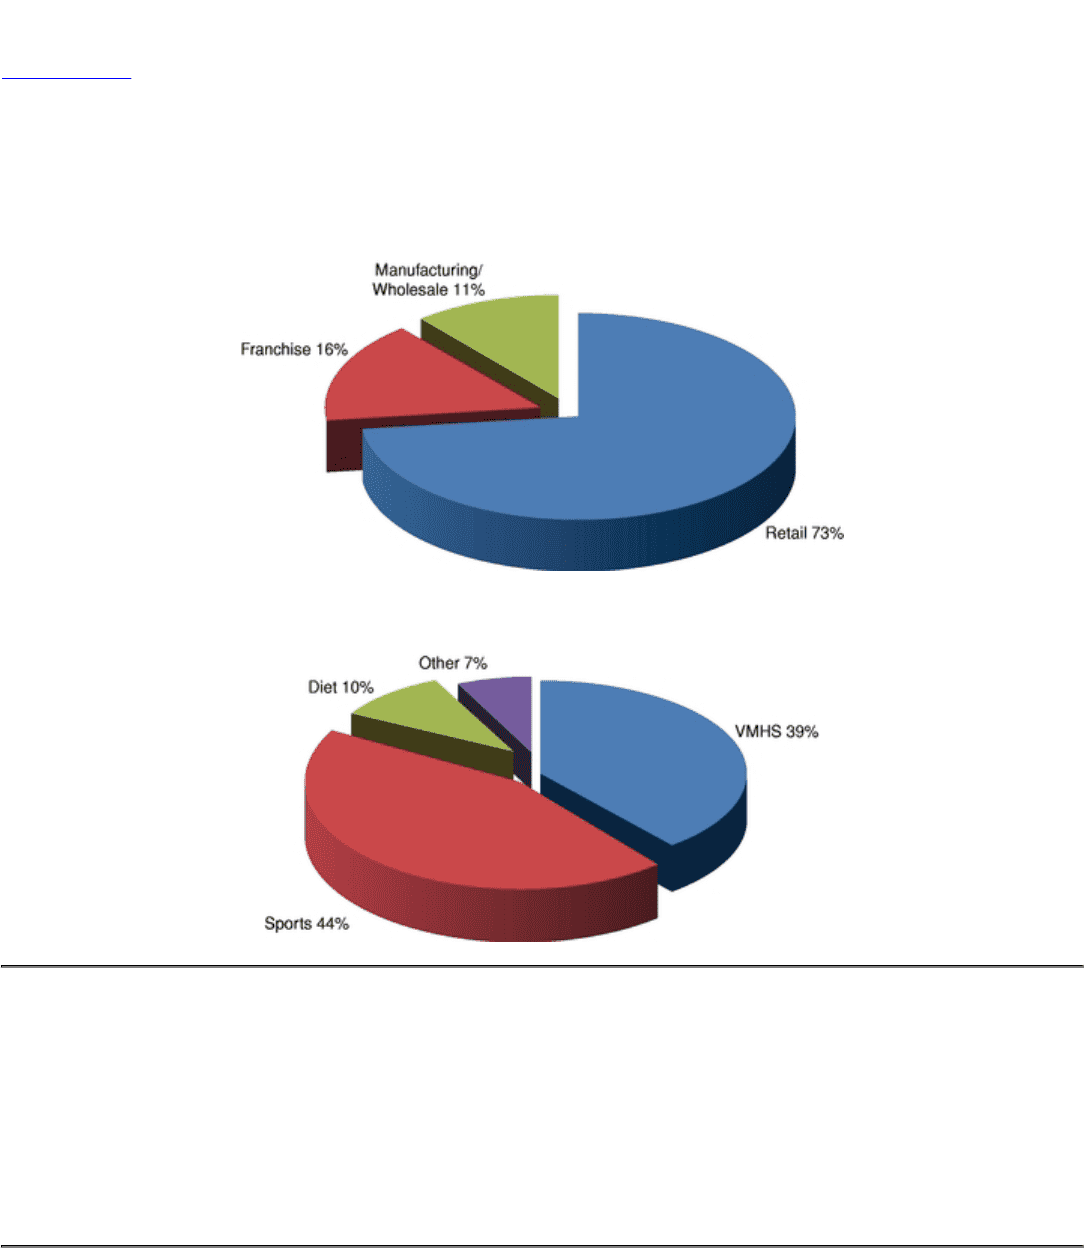
Table of Contents
Business Overview
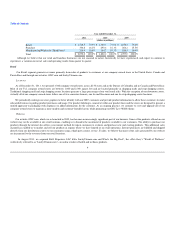
The following charts illustrate the percentage of our net revenue generated by our three segments and the percentage of our net U.S. retail nutritional
supplements revenue generated by our product categories for the year ended December 31, 2011:
Revenue by Segment
U.S. Retail Revenue by Product*
includes domestic retail and GNC.com
In 2011, we did not have a material concentration of sales from any single product or product line.
Segments
We generate revenues from our three segments, Retail, Franchise and Manufacturing/Wholesale. The following chart outlines our segments and the
historical contribution to our consolidated revenues by those segments, after intercompany eliminations. For a description of operating income (loss) by
segment, our total assets by segment, total revenues by geographic area, and total assets by geographic area, see Note 16, "Segments," to our audited
consolidated financial statements included in this Annual Report.
8
*