GNC 2012 Annual Report Download - page 82
Download and view the complete annual report
Please find page 82 of the 2012 GNC annual report below. You can navigate through the pages in the report by either clicking on the pages listed below, or by using the keyword search tool below to find specific information within the annual report.-
 1
1 -
2
-
3
-
4
-
5
-
6
-
7
-
8
-
9
-
10
-
11
-
12
-
13
-
14
-
15
-
16
-
17
-
18
-
19
-
20
-
21
-
22
-
23
-
24
-
25
-
26
-
27
-
28
-
29
-
30
-
31
-
32
-
33
-
34
-
35
-
36
-
37
-
38
-
39
-
40
-
41
-
42
-
43
-
44
-
45
-
46
-
47
-
48
-
49
-
50
-
51
-
52
-
53
-
54
-
55
-
56
-
57
-
58
-
59
-
60
-
61
-
62
-
63
-
64
-
65
-
66
-
67
-
68
-
69
-
70
-
71
-
 72
72 -
 73
73 -
 74
74 -
 75
75 -
 76
76 -
 77
77 -
 78
78 -
 79
79 -
 80
80 -
 81
81 -
 82
82 -
 83
83 -
 84
84 -
 85
85 -
 86
86 -
 87
87 -
 88
88 -
 89
89 -
 90
90 -
 91
91 -
 92
92 -
93
-
94
-
95
-
96
-
97
-
98
-
99
-
100
-
101
-
102
-
103
-
104
-
105
-
106
-
107
-
108
-
109
-
110
-
111
-
112
-
113
-
114
-
115
-
116
-
117
-
118
-
119
-
120
-
121
-
122
-
123
-
124
-
125
-
126
-
127
-
128
-
129
-
130
-
131
-
132
-
133
-
134
-
135
-
136
-
137
-
138
-
139
-
140
-
141
-
142
-
143
-
144
-
145
 |
 |

Table of Contents
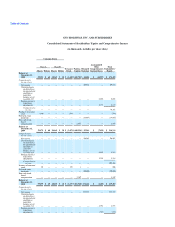
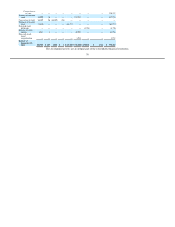
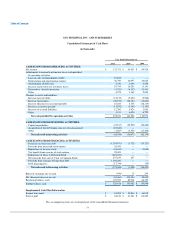
GNC HOLDINGS, INC. AND SUBSIDIARIES
Consolidated Statements of Cash Flows
(in thousands)
Year Ended December 31,
2011 2010 2009
CASH FLOWS FROM OPERATING ACTIVITIES:
Net income $ 132,333 $ 96,567 $ 69,524
Adjustments to reconcile net income to net cash provided
by operating activities:
Loss on early extinguishment of debt 19,855 — —
Depreciation and amortization expense 46,790 46,993 46,665
Amortization of debt costs 2,756 4,694 4,478
Increase in provision for inventory losses 18,745 16,250 11,151
Deferred tax (benefit) provision (5,321) (8,132) 21,431
Other 4,578 3,169 2,855
Changes in assets and liabilities:
Increase in receivables (13,155) (9,620) (5,968)
Increase in inventory (56,919) (26,324) (15,661)
Increase (decrease) in accounts payable 23,243 2,705 (28,119)
Decrease in interest payable (11,832) (1,180) (1,193)
Increase in accrued liabilities 12,290 9,924 2,083
Other 1,311 6,454 6,725
Net cash provided by operating activities 174,674 141,500 113,971
CASH FLOWS FROM INVESTING ACTIVITIES:
Capital expenditures (43,817) (32,522) (28,682)
Acquisition of LuckyVitamin.com, net of cash acquired (19,840) — —
Other (1,887) (3,551) (13,492)
Net cash used in investing activities (65,544) (36,073) (42,174)
CASH FLOWS FROM FINANCING ACTIVITIES:
Payments on long-term debt (1,355,973) (1,721) (25,327)
Proceeds from exercised stock options 28,550 — —
Repurchase of treasury stock (61,634) — (1,065)
Tax benefit from exercise of stock options 22,409 — —
Repurchase of Class A Preferred Stock (223,107) — —
Net proceeds from sale of Class A Common Stock 237,253 233 —
Proceeds from issuance of long-term debt 1,196,200 — —
Debt financing fees (17,346) — (45)
Net cash used in financing activities (173,648) (1,488) (26,437)
Effect of exchange rate on cash (946) 15 249
Net (decrease) increase in cash (65,464) 103,954 45,609
Beginning balance, cash 193,902 89,948 44,339
Ending balance, cash $ 128,438 $ 193,902 $ 89,948
Supplemental Cash Flow Information
Income taxes paid $ 51,088 $ 50,834 $ 16,012
Interest paid $ 64,122 $ 61,862 $ 66,655
The accompanying notes are an integral part of the consolidated financial statements.
77