GNC 2012 Annual Report Download - page 65
Download and view the complete annual report
Please find page 65 of the 2012 GNC annual report below. You can navigate through the pages in the report by either clicking on the pages listed below, or by using the keyword search tool below to find specific information within the annual report.-
 1
1 -
2
-
3
-
4
-
5
-
6
-
7
-
8
-
9
-
10
-
11
-
12
-
13
-
14
-
15
-
16
-
17
-
18
-
19
-
20
-
21
-
22
-
23
-
24
-
25
-
26
-
27
-
28
-
29
-
30
-
31
-
32
-
33
-
34
-
35
-
36
-
37
-
38
-
39
-
40
-
41
-
42
-
43
-
44
-
45
-
46
-
47
-
48
-
49
-
50
-
51
-
52
-
53
-
54
-
 55
55 -
 56
56 -
 57
57 -
 58
58 -
 59
59 -
 60
60 -
 61
61 -
 62
62 -
 63
63 -
 64
64 -
 65
65 -
 66
66 -
 67
67 -
 68
68 -
 69
69 -
 70
70 -
 71
71 -
 72
72 -
 73
73 -
 74
74 -
 75
75 -
76
-
77
-
78
-
79
-
80
-
81
-
82
-
83
-
84
-
85
-
86
-
87
-
88
-
89
-
90
-
91
-
92
-
93
-
94
-
95
-
96
-
97
-
98
-
99
-
100
-
101
-
102
-
103
-
104
-
105
-
106
-
107
-
108
-
109
-
110
-
111
-
112
-
113
-
114
-
115
-
116
-
117
-
118
-
119
-
120
-
121
-
122
-
123
-
124
-
125
-
126
-
127
-
128
-
129
-
130
-
131
-
132
-
133
-
134
-
135
-
136
-
137
-
138
-
139
-
140
-
141
-
142
-
143
-
144
-
145
 |
 |

Table of Contents
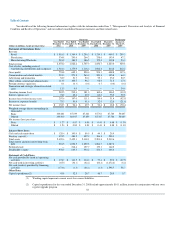
Operating Income
As a result of the foregoing, consolidated operating income increased $31.4 million, or 17.3%, to $212.4 million for the year ended December 31, 2010
compared to $181.0 million in 2009. Operating income, as a percentage of net revenue, was 11.7% and 10.6% for the years ended December 31, 2010 and
2009, respectively.
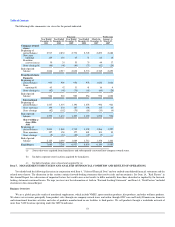
Retail. Operating income increased $28.8 million, or 18.8%, to $181.9 million for the year ended December 31, 2010 compared to $153.1 million in
2009. The increase was primarily the result of higher dollar margins on increased sales volumes offset by increases in occupancy costs, compensation costs
and other SG&A expenses.
Franchise. Operating income increased $13.0 million, or 16.1%, to $93.8 million for the year ended December 31, 2010 compared to $80.8 million in
2009. This increase was due to increases in royalty income, franchise fees, higher dollar margins on increased product sales to franchisees and reductions in
bad debt expenses and amortization expense.
Manufacturing/Wholesale. Operating income decreased $4.1 million, or 5.6%, to $69.4 million for the year ended December 31, 2010 compared to
$73.5 million in 2009. This decrease was primarily the result of lower dollar margins on decreased sales volumes from our South Carolina manufacturing
facility.
Warehousing and Distribution Costs. Unallocated warehousing and distribution costs increased $1.4 million, or 2.6%, to $55.0 million for the year
ended December 31, 2010 compared to $53.6 million in 2009. The increase in costs was primarily due to increases in distribution wages and fuel costs.
Corporate Costs. Corporate overhead costs increased $4.9 million, or 6.7%, to $77.7 million for the year ended December 31, 2010 compared to
$72.8 million in 2009. This increase was due to increases in compensation expenses, incentives and health insurance costs offset by decreases in other SG&A
expenses.
Transaction and strategic alternative related costs. Transaction and strategic alternative related costs were $4.0 million of expenses principally related
to the exploration of strategic alternatives for the year ended December 31, 2010.
Interest Expense
Interest expense decreased $4.5 million, or 6.4%, to $65.4 million for the year ended December 31, 2010 compared to $69.9 million in 2009. This
decrease was primarily attributable to decreases in interest rates on the variable portion of our debt in 2010 compared to 2009.
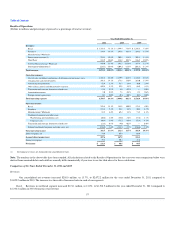
Income Tax Expense
We recognized $50.4 million of income tax expense (or 34.3% of pre-tax income) during the year ended December 31, 2010 compared to $41.6 million
(or 37.4% of pre-tax income) in 2009. In 2010, we recorded a valuation allowance adjustment of $3.1 million, which reduced income tax expense. This
valuation allowance adjustment reflected a change in circumstances that caused a change in judgment about the realizability of certain deferred tax assets
related to state net operating losses. As a result of being able to fully utilize our remaining federal net operating losses in 2009, we were able to realize
additional federal income tax benefits in 2010 related to certain federal tax credits and incentives.
Net Income
As a result of the foregoing, consolidated net income increased $27.1 million to $96.6 million for the year ended December 31, 2010 compared to
$69.5 million in 2009.
62