GNC 2012 Annual Report Download - page 55
Download and view the complete annual report
Please find page 55 of the 2012 GNC annual report below. You can navigate through the pages in the report by either clicking on the pages listed below, or by using the keyword search tool below to find specific information within the annual report.-
 1
1 -
2
-
3
-
4
-
5
-
6
-
7
-
8
-
9
-
10
-
11
-
12
-
13
-
14
-
15
-
16
-
17
-
18
-
19
-
20
-
21
-
22
-
23
-
24
-
25
-
26
-
27
-
28
-
29
-
30
-
31
-
32
-
33
-
34
-
35
-
36
-
37
-
38
-
39
-
40
-
41
-
42
-
43
-
44
-
 45
45 -
 46
46 -
 47
47 -
 48
48 -
 49
49 -
 50
50 -
 51
51 -
 52
52 -
 53
53 -
 54
54 -
 55
55 -
 56
56 -
 57
57 -
 58
58 -
 59
59 -
 60
60 -
 61
61 -
 62
62 -
 63
63 -
 64
64 -
 65
65 -
66
-
67
-
68
-
69
-
70
-
71
-
72
-
73
-
74
-
75
-
76
-
77
-
78
-
79
-
80
-
81
-
82
-
83
-
84
-
85
-
86
-
87
-
88
-
89
-
90
-
91
-
92
-
93
-
94
-
95
-
96
-
97
-
98
-
99
-
100
-
101
-
102
-
103
-
104
-
105
-
106
-
107
-
108
-
109
-
110
-
111
-
112
-
113
-
114
-
115
-
116
-
117
-
118
-
119
-
120
-
121
-
122
-
123
-
124
-
125
-
126
-
127
-
128
-
129
-
130
-
131
-
132
-
133
-
134
-
135
-
136
-
137
-
138
-
139
-
140
-
141
-
142
-
143
-
144
-
145
 |
 |
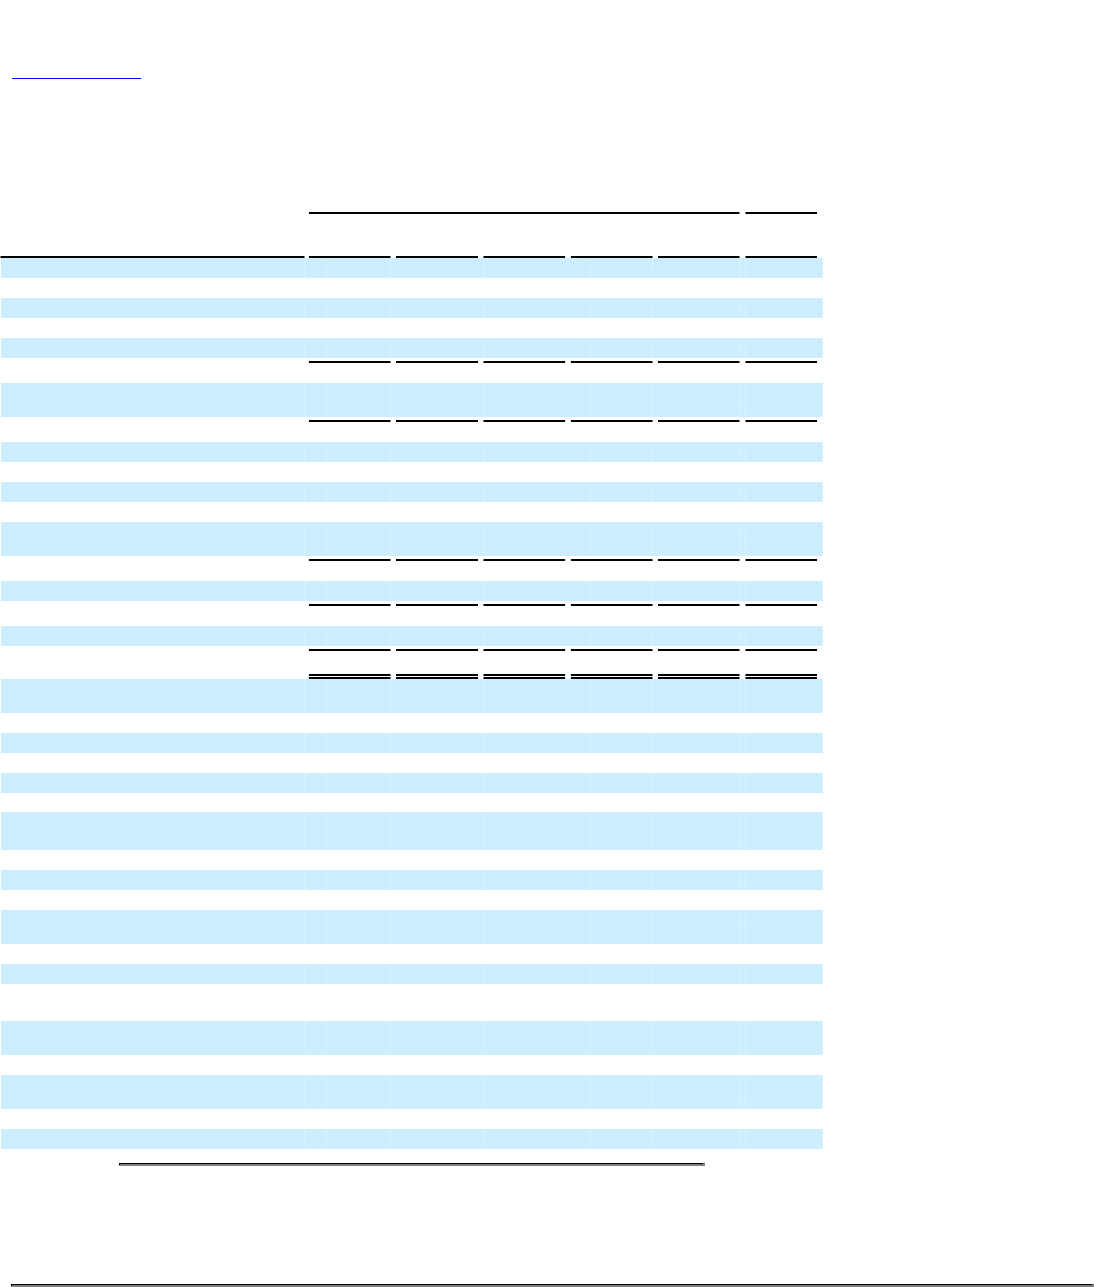
Table of Contents
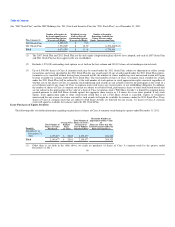
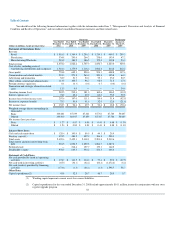
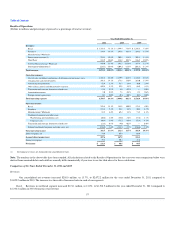
You should read the following financial information together with the information under Item 7, "Management's Discussion and Analysis of Financial
Condition and Results of Operations" and our audited consolidated financial statements and their related notes.
Successor Predecessor
(dollars in millions, except per share data)
Year Ended
December 31,
2011
Year Ended
December 31,
2010
Year Ended
December 31,
2009
Year Ended
December 31,
2008
March 16-
December 31,
2007
January 1-
March 15,
2007
Statement of Operations Data:
Revenue:
Retail $ 1,518.5 $ 1,344.4 $ 1,256.3 $ 1,219.3 $ 909.3 $ 259.3
Franchising 334.8 293.6 264.2 258.0 193.9 47.2
Manufacturing/Wholesale 218.9 184.2 186.5 179.4 119.8 23.3
Total revenue 2,072.2 1,822.2 1,707.0 1,656.7 1,223.0 329.8
Cost of sales, including costs of
warehousing, distribution and occupancy 1,318.4 1,179.9 1,116.4 1,082.6 814.2 212.2
Gross profit 753.8 642.3 590.6 574.1 408.8 117.6
Compensation and related benefits 291.3 273.8 263.0 249.8 195.8 64.3
Advertising and promotion 52.9 51.7 50.0 55.1 35.0 20.5
Other selling, general and administrative 113.5 100.7 96.7 98.9 71.5 17.6
Foreign currency (gain) loss 0.1 (0.3) (0.1) 0.7 (0.4) (0.2)
Transaction and strategic alternative related
costs 13.5 4.0 — — — 34.6
Operating income (loss) 282.5 212.4 181.0 169.6 106.9 (19.2)
Interest expense, net 74.9 65.4 69.9 83.0 75.5 72.8
Income (loss) before income taxes 207.6 147.0 111.1 86.6 31.4 (92.0)
Income tax expense (benefit) 75.3 50.4 41.6 32.0 12.6 (21.6)
Net income (loss) $ 132.3 $ 96.6 $ 69.5 $ 54.6 $ 18.8 $ (70.4)
Weighted average shares outstanding (in
thousands):
Basic 100,261 87,339 87,421 87,761 87,784 50,607
Diluted 103,010 88,917 87,859 87,787 87,784 50,607
Net income (loss) per share:
Basic $ 1.27 $ 0.87 $ 0.58 $ 0.43 $ 0.08 $ (1.39)
Diluted $ 1.24 $ 0.85 $ 0.58 $ 0.43 $ 0.08 $ (1.39)
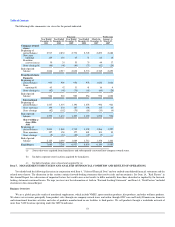
Balance Sheet Data:
Cash and cash equivalents $ 128.4 $ 193.9 $ 89.9 $ 44.3 $ 28.9
Working capital(1) 474.5 484.5 397.0 306.8 258.1
Total assets 2,429.6 2,425.1 2,318.1 2,293.8 2,239.6
Total current and non-current long-term
debt 901.5 1,058.5 1,059.8 1,084.7 1,087.0
Preferred stock — 218.4 197.7 179.3 162.2
Stockholder's equity 978.5 619.5 534.2 474.5 446.4
Statement of Cash Flows:
Net cash provided by (used in) operating
activities $ 174.7 $ 141.5 $ 114.0 $ 77.4 $ 92.0 $ (67.5)
Net cash used in investing activities (65.5) (36.1) (42.2) (60.4) (1,672.2) (6.2)
Net cash (used in) provided by financing
activities (173.6) (1.5) (26.4) (1.4) 1,598.7 58.7
Other Data:
Capital expenditures(2) 43.8 32.5 28.7 48.7 28.9 5.7
Working capital represents current assets less current liabilities.
Capital expenditures for the year ended December 31, 2008 include approximately $10.1 million incurred in conjunction with our store
register upgrade program.
(1)
(2)
52