GNC 2012 Annual Report Download - page 61
Download and view the complete annual report
Please find page 61 of the 2012 GNC annual report below. You can navigate through the pages in the report by either clicking on the pages listed below, or by using the keyword search tool below to find specific information within the annual report.-
 1
1 -
2
-
3
-
4
-
5
-
6
-
7
-
8
-
9
-
10
-
11
-
12
-
13
-
14
-
15
-
16
-
17
-
18
-
19
-
20
-
21
-
22
-
23
-
24
-
25
-
26
-
27
-
28
-
29
-
30
-
31
-
32
-
33
-
34
-
35
-
36
-
37
-
38
-
39
-
40
-
41
-
42
-
43
-
44
-
45
-
46
-
47
-
48
-
49
-
50
-
 51
51 -
 52
52 -
 53
53 -
 54
54 -
 55
55 -
 56
56 -
 57
57 -
 58
58 -
 59
59 -
 60
60 -
 61
61 -
 62
62 -
 63
63 -
 64
64 -
 65
65 -
 66
66 -
 67
67 -
 68
68 -
 69
69 -
 70
70 -
 71
71 -
72
-
73
-
74
-
75
-
76
-
77
-
78
-
79
-
80
-
81
-
82
-
83
-
84
-
85
-
86
-
87
-
88
-
89
-
90
-
91
-
92
-
93
-
94
-
95
-
96
-
97
-
98
-
99
-
100
-
101
-
102
-
103
-
104
-
105
-
106
-
107
-
108
-
109
-
110
-
111
-
112
-
113
-
114
-
115
-
116
-
117
-
118
-
119
-
120
-
121
-
122
-
123
-
124
-
125
-
126
-
127
-
128
-
129
-
130
-
131
-
132
-
133
-
134
-
135
-
136
-
137
-
138
-
139
-
140
-
141
-
142
-
143
-
144
-
145
 |
 |

Table of Contents
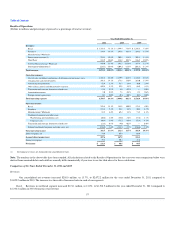
increased $156.2 million, representing a $125.5 million, or 10.1%, increase in our same store sales and a $30.7 million increase in our non-same store sales.
The increase in domestic retail revenues was primarily due to sales increases in the sports nutrition and vitamin product categories, and also included an
increase in sales from GNC.com of $22.1 million, or 37.3%, to $81.1 million in 2011 compared to $59.0 million for 2010. Sales from LuckyVitamin.com
contributed $14.5 million to the increase in revenue. Canadian same store and non same store sales were flat in local currency for 2011 compared to 2010, but
increased by $3.4 million in U.S. dollars. Our company-owned store base increased by 131 domestic stores to 2,879 at December 31, 2011 compared to 2,748
at December 31, 2010, due to new store openings and franchise store acquisitions. Our Canadian store base decreased by 2 stores, with 167 stores at
December 31, 2011 compared to 169 stores at December 31, 2010.
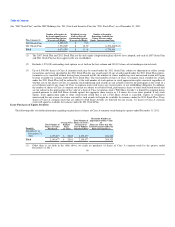
Franchise. Revenues in our Franchise segment increased $41.2 million, or 14.0%, to $334.8 million for the year ended December 31, 2011 compared
to $293.6 million in 2010. Domestic franchise revenues increased $21.5 million to $207.3 million for the year ended December 31, 2011 compared to
$185.9 million in 2010, primarily due to higher wholesale revenues, royalties and fees. Our domestic franchise same store sales for the year ended
December 31, 2011 increased by 7.0% from 2010. There were 924 domestic franchise stores at December 31, 2011 compared to 903 stores at December 31,
2010. International franchise revenue increased by $17.8 million, to $125.5 million for the year ended December 31, 2011 from $107.6 million in 2010,
primarily as a result of increases in product sales, royalties and fees. Our international franchise store base increased by 153 stores to 1,590 at December 31,
2011 compared to 1,437 at December 31, 2010.
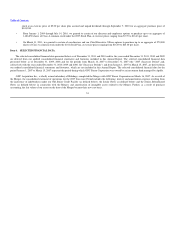
Manufacturing/Wholesale. Revenues in our Manufacturing/Wholesale segment, which includes third-party sales from our manufacturing facilities in
South Carolina, as well as wholesale sales to Rite Aid, PetSmart, Sam's Club and www.drugstore.com, increased by $34.7 million, or 18.8%, to
$218.9 million for the year ended December 31, 2011 compared to $184.2 million in 2010. Third party contract manufacturing sales from our South Carolina
manufacturing plant increased by $13.4 million, or 12.8%, to $118.2 for the year ended December 31, 2011 compared to 2010.
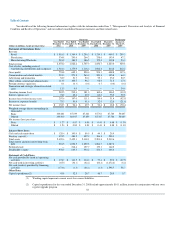
Cost of Sales
Cost of sales, which includes product costs, costs of warehousing and distribution and occupancy costs, increased $138.5 million, or 11.7%, to
$1,318.4 million for the year ended December 31, 2011 compared to $1,179.9 million in 2010. Cost of sales, as a percentage of net revenue, was 63.6% and
64.8% for the year ended December 31, 2011 and 2010, respectively. The increase in cost of sales was primarily due to higher sales volumes and store counts.
Selling, General and Administrative ("SG&A") Expenses
SG&A expenses, including compensation and related benefits, advertising and promotion expense, other SG&A expenses, amortization expense and
transaction and strategic alternative related costs, increased $41.0 million, or 9.5%, to $471.2 million, for the year ended December 31, 2011 compared to
$430.2 million in 2010. These expenses, as a percentage of net revenue, were 22.7% for the year ended December 31, 2011 compared to 23.6% in 2010.
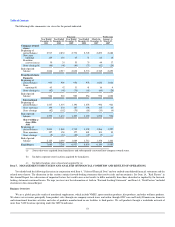
Compensation and related benefits. Compensation and related benefits increased $17.5 million, or 6.4%, to $291.3 million for the year December 31,
2011 compared to $273.8 million in 2010. The increase was due primarily to our increased store base and sales volume, and executive severance of
$3.5 million.
Advertising and promotion. Advertising and promotion expenses increased $1.2 million, or 2.4%, to $52.9 million for the year ended December 31,
2011 compared to $51.7 million in 2010. The increase in advertising and promotion expense was primarily the result of an increase in in-store marketing.
58