GNC 2012 Annual Report Download - page 64
Download and view the complete annual report
Please find page 64 of the 2012 GNC annual report below. You can navigate through the pages in the report by either clicking on the pages listed below, or by using the keyword search tool below to find specific information within the annual report.-
 1
1 -
2
-
3
-
4
-
5
-
6
-
7
-
8
-
9
-
10
-
11
-
12
-
13
-
14
-
15
-
16
-
17
-
18
-
19
-
20
-
21
-
22
-
23
-
24
-
25
-
26
-
27
-
28
-
29
-
30
-
31
-
32
-
33
-
34
-
35
-
36
-
37
-
38
-
39
-
40
-
41
-
42
-
43
-
44
-
45
-
46
-
47
-
48
-
49
-
50
-
51
-
52
-
53
-
 54
54 -
 55
55 -
 56
56 -
 57
57 -
 58
58 -
 59
59 -
 60
60 -
 61
61 -
 62
62 -
 63
63 -
 64
64 -
 65
65 -
 66
66 -
 67
67 -
 68
68 -
 69
69 -
 70
70 -
 71
71 -
 72
72 -
 73
73 -
 74
74 -
75
-
76
-
77
-
78
-
79
-
80
-
81
-
82
-
83
-
84
-
85
-
86
-
87
-
88
-
89
-
90
-
91
-
92
-
93
-
94
-
95
-
96
-
97
-
98
-
99
-
100
-
101
-
102
-
103
-
104
-
105
-
106
-
107
-
108
-
109
-
110
-
111
-
112
-
113
-
114
-
115
-
116
-
117
-
118
-
119
-
120
-
121
-
122
-
123
-
124
-
125
-
126
-
127
-
128
-
129
-
130
-
131
-
132
-
133
-
134
-
135
-
136
-
137
-
138
-
139
-
140
-
141
-
142
-
143
-
144
-
145
 |
 |

Table of Contents
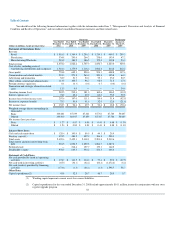
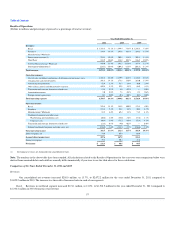
$107.6 million in 2010, compared to $85.5 million in 2009, primarily the result of increases in product sales and royalties. Our international franchise store
base increased by 130 stores to 1,437 at December 31, 2010 compared to 1,307 at December 31, 2009.
Manufacturing/Wholesale. Revenues in our Manufacturing/Wholesale segment, which includes third-party sales from our manufacturing facility in
South Carolina, as well as wholesale sales to Rite Aid, www.drugstore.com and PetSmart, decreased $2.3 million, or 1.2%, to $184.2 million for the year
ended December 31, 2010 compared to $186.5 million in 2009. Third-party sales decreased in the South Carolina manufacturing plant by $15.3 million due
primarily to our transition from low margin commodity products to higher margin, specialty product contracts and other revenue decreased by $1.1 million.
This was partially offset by an increase in wholesale revenue of $14.1 million.
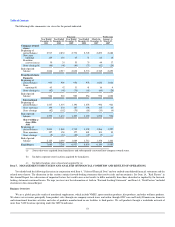
Cost of Sales
Cost of sales, which includes product costs, costs of warehousing and distribution and occupancy costs, increased $63.5 million, or 5.7%, to
$1,179.9 million for the year ended December 31, 2010 compared to $1,116.4 million in 2009. Cost of sales, as a percentage of net revenue, was 64.8% for
the year ended December 31, 2010 compared to 65.4% for the year ended December 31, 2009. Cost of sales increased primarily due to higher sales volumes,
higher lease related costs as a result of operating 85 more stores at December 31, 2010 than 2009, and higher fulfillment costs related to increased web sales.
Selling, General and Administrative Expenses
Our consolidated SG&A expenses, including compensation and related benefits, advertising and promotion expense, other SG&A expenses and
amortization expense, increased $20.5 million, or 5.1%, to $430.2 million, for the year ended December 31, 2010 compared to $409.7 million in 2009. These
expenses, as a percentage of net revenue, were 23.6% for the year ended December 31, 2010 compared to 24.0% for the year ended December 31, 2009.
Compensation and related benefits. Compensation and related benefits increased $10.8 million, or 4.1%, to $273.8 million for the year ended
December 31, 2010 compared to $263.0 million in 2009. The increase was due primarily to support our increased store base and sales volume.
Advertising and promotion. Advertising and promotion expenses increased $1.7 million, or 3.4%, to $51.7 million in 2010 compared to $50.0 million
in 2009. Advertising expense increased primarily as a result of increases in media and production costs of $1.4 million, in store signage costs of $1.3 million
and other advertising costs of $0.9 million, partially offset by decreases in print advertising costs of $1.9 million.
Other SG&A. Other SG&A expenses, including amortization expense, increased $4.0 million, or 4.1%, to $100.7 million for the year ended
December 31, 2010 compared to $96.7 million for the year ended December 31, 2009. Increases in other SG&A expenses included telecom expenses,
commissions, credit card fees and other expense. These were partially offset by decreases in amortization and depreciation expenses and bad debt expense.
Transaction and strategic alternative related costs. In addition to the above, we incurred $4.0 million of expenses principally related to the exploration
of strategic alternatives.
Foreign Currency (Loss) Gain
Foreign currency (loss) gain for the years ended December 31, 2010 and 2009 resulted primarily from accounts payable activity with our Canadian
subsidiary.
61