GNC 2012 Annual Report Download - page 109
Download and view the complete annual report
Please find page 109 of the 2012 GNC annual report below. You can navigate through the pages in the report by either clicking on the pages listed below, or by using the keyword search tool below to find specific information within the annual report.-
 1
1 -
2
-
3
-
4
-
5
-
6
-
7
-
8
-
9
-
10
-
11
-
12
-
13
-
14
-
15
-
16
-
17
-
18
-
19
-
20
-
21
-
22
-
23
-
24
-
25
-
26
-
27
-
28
-
29
-
30
-
31
-
32
-
33
-
34
-
35
-
36
-
37
-
38
-
39
-
40
-
41
-
42
-
43
-
44
-
45
-
46
-
47
-
48
-
49
-
50
-
51
-
52
-
53
-
54
-
55
-
56
-
57
-
58
-
59
-
60
-
61
-
62
-
63
-
64
-
65
-
66
-
67
-
68
-
69
-
70
-
71
-
72
-
73
-
74
-
75
-
76
-
77
-
78
-
79
-
80
-
81
-
82
-
83
-
84
-
85
-
86
-
87
-
88
-
89
-
90
-
91
-
92
-
93
-
94
-
95
-
96
-
97
-
98
-
 99
99 -
 100
100 -
 101
101 -
 102
102 -
 103
103 -
 104
104 -
 105
105 -
 106
106 -
 107
107 -
 108
108 -
 109
109 -
 110
110 -
 111
111 -
 112
112 -
 113
113 -
 114
114 -
 115
115 -
 116
116 -
 117
117 -
 118
118 -
 119
119 -
120
-
121
-
122
-
123
-
124
-
125
-
126
-
127
-
128
-
129
-
130
-
131
-
132
-
133
-
134
-
135
-
136
-
137
-
138
-
139
-
140
-
141
-
142
-
143
-
144
-
145
 |
 |

Table of Contents
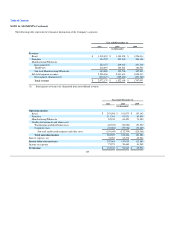
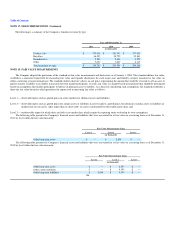
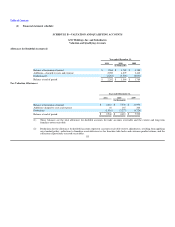
NOTE 16. SEGMENTS (Continued)
December 31,
2011 2010 2009
(in thousands)
Depreciation and amortization:
Retail $ 25,982 $ 26,241 $ 24,164
Franchise 2,873 3,044 4,081
Manufacturing / Wholesale 11,585 11,407 10,926
Corporate / Other 6,350 6,301 7,494
Total depreciation and amortization $ 46,790 $ 46,993 $ 46,665
Capital expenditures:
Retail $ 29,331 $ 23,263 $ 20,640
Franchise 684 50 2
Manufacturing / Wholesale 7,534 4,318 4,527
Corporate / Other 6,268 4,891 3,513
Total capital expenditures $ 43,817 $ 32,522 $ 28,682
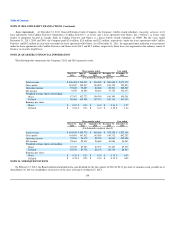
Total assets
Retail $ 1,339,325 $ 1,272,541 $ 1,262,755
Franchise 491,008 477,230 468,949
Manufacturing / Wholesale 410,171 410,832 423,884
Corporate / Other 189,083 264,480 162,506
Total assets $ 2,429,587 $ 2,425,083 $ 2,318,094
Geographic areas
Total revenues:
United States $ 1,972,121 $ 1,727,489 $ 1,618,452
Foreign 100,058 94,679 88,555
Total revenues $ 2,072,179 $ 1,822,168 $ 1,707,007
Long-lived assets:
United States $ 196,176 $ 188,988 $ 193,762
Foreign 9,251 10,207 10,151
Total long-lived assets 205,427 $ 199,195 $ 203,913
104