GNC 2012 Annual Report Download - page 80
Download and view the complete annual report
Please find page 80 of the 2012 GNC annual report below. You can navigate through the pages in the report by either clicking on the pages listed below, or by using the keyword search tool below to find specific information within the annual report.-
 1
1 -
2
-
3
-
4
-
5
-
6
-
7
-
8
-
9
-
10
-
11
-
12
-
13
-
14
-
15
-
16
-
17
-
18
-
19
-
20
-
21
-
22
-
23
-
24
-
25
-
26
-
27
-
28
-
29
-
30
-
31
-
32
-
33
-
34
-
35
-
36
-
37
-
38
-
39
-
40
-
41
-
42
-
43
-
44
-
45
-
46
-
47
-
48
-
49
-
50
-
51
-
52
-
53
-
54
-
55
-
56
-
57
-
58
-
59
-
60
-
61
-
62
-
63
-
64
-
65
-
66
-
67
-
68
-
69
-
 70
70 -
 71
71 -
 72
72 -
 73
73 -
 74
74 -
 75
75 -
 76
76 -
 77
77 -
 78
78 -
 79
79 -
 80
80 -
 81
81 -
 82
82 -
 83
83 -
 84
84 -
 85
85 -
 86
86 -
 87
87 -
 88
88 -
 89
89 -
 90
90 -
91
-
92
-
93
-
94
-
95
-
96
-
97
-
98
-
99
-
100
-
101
-
102
-
103
-
104
-
105
-
106
-
107
-
108
-
109
-
110
-
111
-
112
-
113
-
114
-
115
-
116
-
117
-
118
-
119
-
120
-
121
-
122
-
123
-
124
-
125
-
126
-
127
-
128
-
129
-
130
-
131
-
132
-
133
-
134
-
135
-
136
-
137
-
138
-
139
-
140
-
141
-
142
-
143
-
144
-
145
 |
 |

Table of Contents
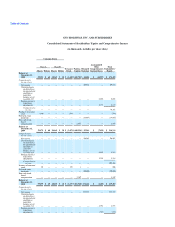
GNC HOLDINGS, INC. AND SUBSIDIARIES
Consolidated Statements of Stockholders' Equity and Comprehensive Income
(in thousands, includes per share data)
Common Stock
Class A Class B
Accumulated
Other
Comprehensive
Income/(Loss)
Treasury
Stock Paid-in-
Capital Retained
Earnings
Total
Stockholders'
Equity
Shares Dollars Shares Dollars
Balance at
December 31,
2008 59,510 $ 60 28,169 $ 28 $ (1,680)$445,701 $ 44,406 $ (14,057) $ 474,458
Comprehensive
income (loss):
Net income — — — — — — 69,524 — 69,524
Unrealized gain
on derivatives
designated and
qualified as
cash flow
hedges, net of
tax of $1,537 — — — — — — — 2,686 2,686
Foreign currency
translation
adjustments — — — — — — — 4,172 4,172
Comprehensive
income — — — — — — — 76,382
Purchase of treasury
stock (340) — — — (794) — — — (794)
Preferred stock
dividends — — — — — — (18,667) — (18,667)
Non-cash stock-
based
compensation — — — — — 2,855 — — 2,855
Balance at
December 31,
2009 59,170 $ 60 28,169 $ 28 $ (2,474)$448,556 $ 95,263 $ (7,199) $ 534,234
Comprehensive
income (loss):
Net income — — — — — — 96,567 — 96,567
Unrealized gain
on derivatives
designated and
qualified as
cash flow
hedges, net of
tax of $2,625 — — — — — — — 4,585 4,585
Foreign currency
translation
adjustments — — — — — — — 1,334 1,334
Comprehensive
income — — — — — — — 102,486
Issuance of common
stock 29 — — — 197 3 — — 200
Preferred stock
dividends — — — — — — (20,606) — (20,606)
Non-cash stock-
based
compensation — — — — — 3,169 — — 3,169
Balance at
December 31,
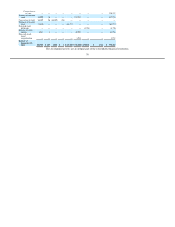
2010 59,199 $ 60 28,169 $ 28 $ (2,277)$451,728 $171,224 $ (1,280) $ 619,483
Comprehensive
income (loss):
Net income — — — — — — 132,333 — 132,333
Unrealized gain
on derivatives
designated and
qualified as
cash flow
hedges, net of
tax of $2,718 — — — — — — — 4,751 4,751
Foreign currency
translation
adjustments — — — — — — — (747) (747)