GNC 2012 Annual Report Download - page 66
Download and view the complete annual report
Please find page 66 of the 2012 GNC annual report below. You can navigate through the pages in the report by either clicking on the pages listed below, or by using the keyword search tool below to find specific information within the annual report.-
 1
1 -
2
-
3
-
4
-
5
-
6
-
7
-
8
-
9
-
10
-
11
-
12
-
13
-
14
-
15
-
16
-
17
-
18
-
19
-
20
-
21
-
22
-
23
-
24
-
25
-
26
-
27
-
28
-
29
-
30
-
31
-
32
-
33
-
34
-
35
-
36
-
37
-
38
-
39
-
40
-
41
-
42
-
43
-
44
-
45
-
46
-
47
-
48
-
49
-
50
-
51
-
52
-
53
-
54
-
55
-
 56
56 -
 57
57 -
 58
58 -
 59
59 -
 60
60 -
 61
61 -
 62
62 -
 63
63 -
 64
64 -
 65
65 -
 66
66 -
 67
67 -
 68
68 -
 69
69 -
 70
70 -
 71
71 -
 72
72 -
 73
73 -
 74
74 -
 75
75 -
 76
76 -
77
-
78
-
79
-
80
-
81
-
82
-
83
-
84
-
85
-
86
-
87
-
88
-
89
-
90
-
91
-
92
-
93
-
94
-
95
-
96
-
97
-
98
-
99
-
100
-
101
-
102
-
103
-
104
-
105
-
106
-
107
-
108
-
109
-
110
-
111
-
112
-
113
-
114
-
115
-
116
-
117
-
118
-
119
-
120
-
121
-
122
-
123
-
124
-
125
-
126
-
127
-
128
-
129
-
130
-
131
-
132
-
133
-
134
-
135
-
136
-
137
-
138
-
139
-
140
-
141
-
142
-
143
-
144
-
145
 |
 |

Table of Contents
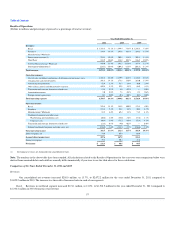
Liquidity and Capital Resources
At December 31, 2011, we had $128.4 million in cash and cash equivalents and $474.5 million in working capital, compared with $193.9 million in cash
and cash equivalents and $484.5 million in working capital at December 31, 2010. The $10.0 million decrease in our working capital was primarily due to a
decrease in cash related to our repurchase of an aggregate of $61.6 million in shares of Class A common stock under a stock repurchase program and
repayment of indebtedness in connection with the IPO.
At December 31, 2010, we had $193.9 million in cash and cash equivalents and $484.5 million in working capital, compared to $89.9 million in cash and
cash equivalents and $397.0 million in working capital at December 31, 2009. The $87.5 million increase in our working capital was primarily due to the
increase in cash resulting from the increase in our net income.
We expect to fund our operations through internally generated cash and, if necessary, from borrowings under the Revolving Credit Facility. At
December 31, 2011, we had $72.0 million available under the Revolving Credit Facility, after giving effect to $8.0 million utilized to secure letters of credit.
We expect that our primary uses of cash in the near future will be for capital expenditures, working capital requirements, repurchase of additional shares
of Class A common stock under repurchase programs and funding any quarterly dividends to stockholders that are approved by the Board.
We currently anticipate that cash generated from operations, together with amounts available under the Revolving Credit Facility, will be sufficient for
the term of the Revolving Credit Facility, which matures on March 15, 2016, to meet our operating expenses and capital expenditures as they become due.
Due to the repayment of $300.0 million of indebtedness under the Term Loan Facility in 2011 with a portion of the proceeds from the IPO, no payments are
due under the Term Loan Facility until 2018. Our ability to make scheduled payments of principal on, to pay interest on or to refinance our debt and to satisfy
our other debt obligations will depend on our future operating performance, which will be affected by general economic, financial and other factors beyond
our control. We are currently in compliance with our debt covenant reporting and compliance obligations under the Senior Credit Facility.
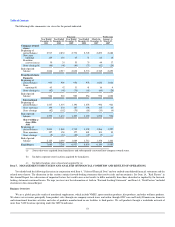
Cash Provided by Operating Activities
Cash provided by operating activities was $174.7 million, $141.5 million and $114.0 million during the years ended December 31, 2011, 2010 and 2009,
respectively. The increases from each of 2009 to 2010 to 2011 was primarily due to an increase in net income. Net income increased $35.8 million in 2011
compared to 2010. Net income increased $27.0 million in 2010 compared to 2009.
For the year ended December 31, 2011, inventory increased $56.9 million compared to 2010 as a result of increases in our finished goods. Accounts
payable increased $23.2 million due to the increase in inventory and timing of payments. Accounts receivable increased $13.2 million, primarily due to
increased sales to franchisees. Accrued liabilities increased by $12.3 million, primarily due to increased deferred revenue.
In 2010, inventory increased $26.3 million compared to 2009 as a result of increases in our finished goods. Accounts receivable increased $9.6 million,
primarily due to increased sales to franchisees. Accrued liabilities increased by $9.9 million, primarily due to increased deferred revenue.
Cash Used in Investing Activities
We used cash from investing activities of $65.5 million, $36.1 million and $42.2 million for the years ended December 31, 2011, 2010 and 2009,
respectively. Capital expenditures, which were primarily for improvements to our retail stores and our South Carolina manufacturing facility, were
$43.8 million, $32.5 million and $28.7 million for the years ended December 31, 2011, 2010 and 2009, respectively. Also in 2011, we spent $19.8 million
related to the acquisition of LuckyVitamin.com.
63