GNC 2012 Annual Report Download - page 108
Download and view the complete annual report
Please find page 108 of the 2012 GNC annual report below. You can navigate through the pages in the report by either clicking on the pages listed below, or by using the keyword search tool below to find specific information within the annual report.-
 1
1 -
2
-
3
-
4
-
5
-
6
-
7
-
8
-
9
-
10
-
11
-
12
-
13
-
14
-
15
-
16
-
17
-
18
-
19
-
20
-
21
-
22
-
23
-
24
-
25
-
26
-
27
-
28
-
29
-
30
-
31
-
32
-
33
-
34
-
35
-
36
-
37
-
38
-
39
-
40
-
41
-
42
-
43
-
44
-
45
-
46
-
47
-
48
-
49
-
50
-
51
-
52
-
53
-
54
-
55
-
56
-
57
-
58
-
59
-
60
-
61
-
62
-
63
-
64
-
65
-
66
-
67
-
68
-
69
-
70
-
71
-
72
-
73
-
74
-
75
-
76
-
77
-
78
-
79
-
80
-
81
-
82
-
83
-
84
-
85
-
86
-
87
-
88
-
89
-
90
-
91
-
92
-
93
-
94
-
95
-
96
-
97
-
 98
98 -
 99
99 -
 100
100 -
 101
101 -
 102
102 -
 103
103 -
 104
104 -
 105
105 -
 106
106 -
 107
107 -
 108
108 -
 109
109 -
 110
110 -
 111
111 -
 112
112 -
 113
113 -
 114
114 -
 115
115 -
 116
116 -
 117
117 -
 118
118 -
119
-
120
-
121
-
122
-
123
-
124
-
125
-
126
-
127
-
128
-
129
-
130
-
131
-
132
-
133
-
134
-
135
-
136
-
137
-
138
-
139
-
140
-
141
-
142
-
143
-
144
-
145
 |
 |

Table of Contents
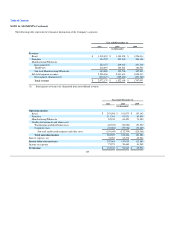
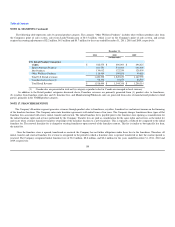
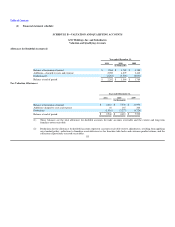
NOTE 16. SEGMENTS (Continued)
The following table represents key financial information of the Company's segments:
Year ended December 31,
2011 2010 2009
(in thousands)
Revenue:
Retail $ 1,518,494 $ 1,344,358 $ 1,256,314
Franchise 334,792 293,549 264,168
Manufacturing/Wholesale:
Intersegment(1) 224,127 209,465 201,306
Third Party 218,893 184,261 186,525
Sub total Manufacturing/Wholesale 443,020 393,726 387,831
Sub total segment revenues 2,296,306 2,031,633 1,908,313
Intersegment elimination(1) (224,127) (209,465) (201,306)
Total revenue $ 2,072,179 $ 1,822,168 $ 1,707,007
Intersegment revenues are eliminated from consolidated revenue.(1)
Year ended December 31,
2011 2010 2009
(in thousands)
Operating income:
Retail $ 243,506 $ 181,873 $ 153,142
Franchise 111,261 93,821 80,800
Manufacturing/Wholesale 82,185 69,421 73,450
Unallocated corporate and other costs:
Warehousing and distribution costs (60,539) (54,983) (53,557)
Corporate costs (93,906) (77,726) (72,809)
Sub total unallocated corporate and other costs (154,445) (132,709) (126,366)
Total operating income 282,507 212,406 181,026
Interest expense, net 74,903 65,376 69,940
Income before income taxes 207,604 147,030 111,086
Income tax expense 75,271 50,463 41,562
Net income $ 132,333 $ 96,567 $ 69,524
103