GNC 2012 Annual Report Download - page 111
Download and view the complete annual report
Please find page 111 of the 2012 GNC annual report below. You can navigate through the pages in the report by either clicking on the pages listed below, or by using the keyword search tool below to find specific information within the annual report.-
 1
1 -
2
-
3
-
4
-
5
-
6
-
7
-
8
-
9
-
10
-
11
-
12
-
13
-
14
-
15
-
16
-
17
-
18
-
19
-
20
-
21
-
22
-
23
-
24
-
25
-
26
-
27
-
28
-
29
-
30
-
31
-
32
-
33
-
34
-
35
-
36
-
37
-
38
-
39
-
40
-
41
-
42
-
43
-
44
-
45
-
46
-
47
-
48
-
49
-
50
-
51
-
52
-
53
-
54
-
55
-
56
-
57
-
58
-
59
-
60
-
61
-
62
-
63
-
64
-
65
-
66
-
67
-
68
-
69
-
70
-
71
-
72
-
73
-
74
-
75
-
76
-
77
-
78
-
79
-
80
-
81
-
82
-
83
-
84
-
85
-
86
-
87
-
88
-
89
-
90
-
91
-
92
-
93
-
94
-
95
-
96
-
97
-
98
-
99
-
100
-
 101
101 -
 102
102 -
 103
103 -
 104
104 -
 105
105 -
 106
106 -
 107
107 -
 108
108 -
 109
109 -
 110
110 -
 111
111 -
 112
112 -
 113
113 -
 114
114 -
 115
115 -
 116
116 -
 117
117 -
 118
118 -
 119
119 -
 120
120 -
 121
121 -
122
-
123
-
124
-
125
-
126
-
127
-
128
-
129
-
130
-
131
-
132
-
133
-
134
-
135
-
136
-
137
-
138
-
139
-
140
-
141
-
142
-
143
-
144
-
145
 |
 |

Table of Contents
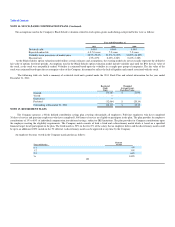
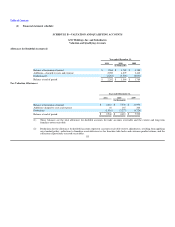
NOTE 17. FRANCHISE REVENUE (Continued)
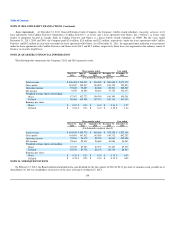
The following is a summary of the Company's franchise revenue by type:
Year ended December 31,
2011 2010 2009
(in thousands)
Product sales $ 275,026 $ 241,932 $ 217,920
Royalties 46,507 38,722 35,561
Franchise fees 5,585 5,646 4,570
Other 7,674 7,249 6,117
Total franchise revenue $ 334,792 $ 293,549 $ 264,168
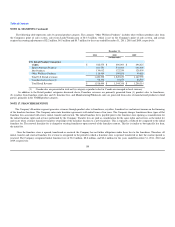
NOTE 18. FAIR VALUE MEASUREMENTS
The Company adopted the provisions of the standard on fair value measurements and disclosures as of January 1, 2008. This standard defines fair value,
establishes a consistent framework for measuring fair value and expands disclosures for each major asset and liability category measured at fair value on
either a recurring or nonrecurring basis. The standard clarifies that fair value is an exit price, representing the amount that would be received to sell an asset or
paid to transfer a liability in an orderly transaction between market participants. As such, fair value is a market-based measurement that should be determined
based on assumptions that market participants would use in pricing an asset or liability. As a basis for considering such assumptions, the standard establishes a
three-tier fair value hierarchy which prioritizes the inputs used in measuring fair value as follows:
Level 1 — observable inputs such as quoted prices in active markets for identical assets and liabilities;
Level 2
—
observable inputs such as quoted prices for similar assets or liabilities in active markets, quoted prices for identical or similar assets or liabilities in
markets that are not active, other inputs that are observable, or can be corroborated by observable market data; and
Level 3
—
unobservable inputs for which there are little or no market data, which require the reporting entity to develop its own assumptions.
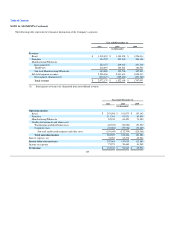
The following table presents the Company's financial assets and liabilities that were accounted for at fair value on a recurring basis as of December 31,
2011 by level within the fair value hierarchy:
Fair Value Measurements Using
Level 1 Level 2 Level 3
(in thousands)
Other long-term assets $ — $ 2,699 $ —
The following table presents the Company's financial assets and liabilities that were accounted for at fair value on a recurring basis as of December 31,
2010 by level within the fair value hierarchy:
Fair Value Measurements Using
Level 1 Level 2 Level 3
(in thousands)
Other long-term assets $ — $ 2,577 $ —
Other current liabilities $ — $ 4,395 $ —
Other long-term liabilities $ 3,034 $ 3,074 $ —
106