Express Scripts 2009 Annual Report Download - page 91
Download and view the complete annual report
Please find page 91 of the 2009 Express Scripts annual report below. You can navigate through the pages in the report by either clicking on the pages listed below, or by using the keyword search tool below to find specific information within the annual report.-
 1
1 -
2
-
3
-
4
-
5
-
6
-
7
-
8
-
9
-
10
-
11
-
12
-
13
-
14
-
15
-
16
-
17
-
18
-
19
-
20
-
21
-
22
-
23
-
24
-
25
-
26
-
27
-
28
-
29
-
30
-
31
-
32
-
33
-
34
-
35
-
36
-
37
-
38
-
39
-
40
-
41
-
42
-
43
-
44
-
45
-
46
-
47
-
48
-
49
-
50
-
51
-
52
-
53
-
54
-
55
-
56
-
57
-
58
-
59
-
60
-
61
-
62
-
63
-
64
-
65
-
66
-
67
-
68
-
69
-
70
-
71
-
72
-
73
-
74
-
75
-
76
-
77
-
78
-
79
-
80
-
 81
81 -
 82
82 -
 83
83 -
 84
84 -
 85
85 -
 86
86 -
 87
87 -
 88
88 -
 89
89 -
 90
90 -
 91
91 -
 92
92 -
 93
93 -
 94
94 -
 95
95 -
 96
96 -
 97
97 -
 98
98 -
 99
99 -
 100
100 -
 101
101 -
102
-
103
-
104
-
105
-
106
-
107
-
108
 |
 |

Express Scripts 2009 Annual Report
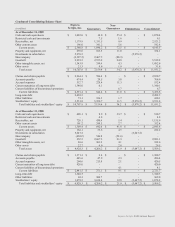
Condensed Consolidating Balance Sheet
(in millions)
Express
Scripts, Inc.
Guarantors
Non-
Guarantors
Eliminations
Consolidated
As of December 31, 2009
Cash and cash equivalents
$
1,005.0
$
10.0
$
55.4
$
-
$
1,070.4
Restricted cash and investments
-
7.5
1.6
-
9.1
Receivables, net
1,179.8
1,331.5
9.9
-
2,521.2
Other current assets
196.0
341.2
5.6
-
542.8
Current assets
$
2,380.8
$
1,690.2
$
72.5
$
-
$
4,143.5
Property and equipment, net
239.6
103.5
11.0
-
354.1
Investments in subsidiaries
5,970.2
-
-
(5,970.2)
-
Intercompany
(2,387.2)
2,467.5
(80.3)
-
-
Goodwill
2,939.2
2,555.2
24.8
-
5,519.2
Other intangible assets, net
1,543.9
334.4
4.3
-
1,882.6
Other assets
21.3
8.6
1.9
-
31.8
Total assets
$
10,707.8
$
7,159.4
$
34.2
$
(5,970.2)
$
11,931.2
Claims and rebates payable
$
2,264.3
$
586.4
$
-
$
-
$
2,850.7
Accounts payable
674.4
29.5
3.0
-
706.9
Accrued expenses
312.7
228.4
11.3
-
552.4
Current maturities of long-term debt
1,340.0
0.1
-
-
1,340.1
Current liabilities of discontinued operations
-
-
6.7
-
6.7
Current liabilities
$
4,591.4
$
844.4
$
21.0
$
-
$
5,456.8
Long-term debt
2,492.5
-
-
-
2,492.5
Other liabilities
72.1
356.3
1.7
-
430.1
Stockholders’ equity
3,551.8
5,958.7
11.5
(5,970.2)
3,551.8
Total liabilities and stockholders’ equity
$
10,707.8
$
7,159.4
$
34.2
$
(5,970.2)
$
11,931.2
As of December 31, 2008
Cash and cash equivalents
$
488.1
$
8.9
$
33.7
$
-
$
530.7
Restricted cash and investments
-
4.8
-
-
4.8
Receivables, net
720.1
430.4
5.4
-
1,155.9
Other current assets
101.2
248.5
2.7
-
352.4
Current assets
$
1,309.4
$
692.6
$
41.8
$
-
$
2,043.8
Property and equipment, net
164.1
53.6
4.5
-
222.2
Investments in subsidiaries
3,647.2
-
-
(3,647.2)
-
Intercompany
(494.2)
546.8
(52.6)
-
-
Goodwill
252.5
2,607.3
21.3
-
2,881.1
Other intangible assets, net
26.6
301.9
4.1
-
332.6
Other assets
22.7
4.0
2.8
-
29.5
Total assets
$
4,928.3
$
4,206.2
$
21.9
$
(3,647.2)
$
5,509.2
Claims and rebates payable
$
1,371.3
$
9.4
$
-
$
-
$
1,380.7
Accounts payable
445.6
47.9
2.9
-
496.4
Accrued expenses
204.6
213.8
2.1
-
420.5
Current maturities of long-term debt
420.0
-
-
-
420.0
Current liabilities of discontinued operations
-
-
4.1
-
4.1
Current liabilities
$
2,441.5
$
271.1
$
9.1
$
-
$
2,721.7
Long-term debt
1,340.3
-
-
-
1,340.3
Other liabilities
68.3
300.7
-
-
369.0
Stockholders’ equity
1,078.2
3,634.4
12.8
(3,647.2)
1,078.2
Total liabilities and stockholders’ equity
$
4,928.3
$
4,206.2
$
21.9
$
(3,647.2)
$
5,509.2
89