Express Scripts 2009 Annual Report Download - page 72
Download and view the complete annual report
Please find page 72 of the 2009 Express Scripts annual report below. You can navigate through the pages in the report by either clicking on the pages listed below, or by using the keyword search tool below to find specific information within the annual report.-
 1
1 -
2
-
3
-
4
-
5
-
6
-
7
-
8
-
9
-
10
-
11
-
12
-
13
-
14
-
15
-
16
-
17
-
18
-
19
-
20
-
21
-
22
-
23
-
24
-
25
-
26
-
27
-
28
-
29
-
30
-
31
-
32
-
33
-
34
-
35
-
36
-
37
-
38
-
39
-
40
-
41
-
42
-
43
-
44
-
45
-
46
-
47
-
48
-
49
-
50
-
51
-
52
-
53
-
54
-
55
-
56
-
57
-
58
-
59
-
60
-
61
-
 62
62 -
 63
63 -
 64
64 -
 65
65 -
 66
66 -
 67
67 -
 68
68 -
 69
69 -
 70
70 -
 71
71 -
 72
72 -
 73
73 -
 74
74 -
 75
75 -
 76
76 -
 77
77 -
 78
78 -
 79
79 -
 80
80 -
 81
81 -
 82
82 -
83
-
84
-
85
-
86
-
87
-
88
-
89
-
90
-
91
-
92
-
93
-
94
-
95
-
96
-
97
-
98
-
99
-
100
-
101
-
102
-
103
-
104
-
105
-
106
-
107
-
108
 |
 |

Express Scripts 2009 Annual Report 70
assets or liabilities classified as Level 3 prior to the third quarter of 2008.
In February 2007, the FASB issued authoritative guidance under which a company may elect to measure
eligible financial assets and financial liabilities at fair value. Unrealized gains and losses on items for which the fair
value option has been elected are reported in earnings at each subsequent reporting date. Eligible items include, but
are not limited to, accounts and loans receivable, equity method investments, accounts payable, guarantees, issued
debt and firm commitments. If elected, this guidance is effective for fiscal years beginning after November 15, 2007.
Currently, we have not elected to account for any of our eligible items using the fair value option under this
guidance.
In April 2009, the FASB issued (1) guidance on determining fair value when market activity has decreased,
(2) guidance which addresses other-than-temporary impairments for debt securities; and (3) guidance which
discusses fair value disclosures for financial instruments in interim periods. The guidance is effective for interim
and annual periods ending after June 15, 2009 and the adoption did not have a material impact on our financial
statements.
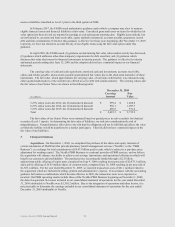
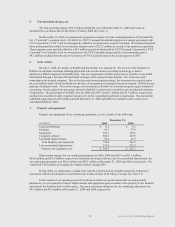
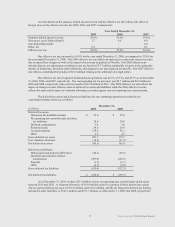
The carrying value of cash and cash equivalents, restricted cash and investments, accounts receivable,
claims and rebates payable, and accounts payable approximated fair values due to the short-term maturities of these
instruments. The fair value, which approximates the carrying value, of our bank credit facility was estimated using
either quoted market prices or the current rates offered to us for debt with similar maturity. The carrying values and
the fair values of our Senior Notes are shown in the following table:
December 31, 2009
(in millions)
Carrying
Amount
Fair
Value
5.25% senior notes due 2012, net of unamortized discount
$
999.4
$
1,068.6
6.25% senior notes due 2014, net of unamortized discount
996.1
1,095.7
7.25% senior notes due 2019, net of unamortized discount
496.8
591.6
Total
$
2,492.3
$
2,755.9
The fair values of our Senior Notes were estimated based on quoted prices in active markets for identical
securities (Level 1 inputs). In determining the fair value of liabilities, we took into consideration the risk of
nonperformance. Nonperformance risk refers to the risk that the obligation will not be fulfilled and affects the value
at which the liability would be transferred to a market participant. This risk did not have a material impact on the
fair value of our liabilities.
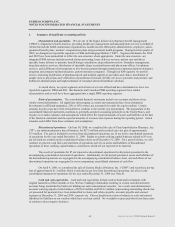
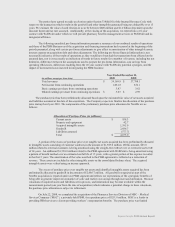
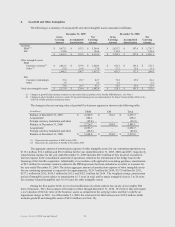
3. Changes in business
Acquisitions. On December 1, 2009, we completed the purchase of the shares and equity interests of
certain subsidiaries of WellPoint that provide pharmacy benefit management services (“NextRx” or the “PBM
Business”), in exchange for total consideration of $4.675 billion paid in cash, which is subject to a purchase price
adjustment for working capital. The NextRx PBM Business is a national provider of PBM services, and we believe
the acquisition will enhance our ability to achieve cost savings, innovations, and operational efficiencies which will
benefit our customers and stockholders. The purchase price was primarily funded through a $2.5 billion
underwritten public offering of senior notes completed on June 9, 2009 resulting in net proceeds of $2,478.3 million,
and a public offering of 26.45 million shares of common stock completed June 10, 2009 resulting in net proceeds of
$1,569.1 million. For the year ended December 31, 2009, we incurred transaction costs of $61.1 million related to
the acquisition which are included in selling, general and administrative expense. In accordance with the accounting
guidance for business combinations which became effective in 2009, the transaction costs were expensed as
incurred. Our PBM operating results include those of the NextRx PBM Business beginning on December 1, 2009,
the date of acquisition. Revenues included in our consolidated statement of operations for the year ended December
31, 2009 attributable to NextRx were $1,358.2 million. Due to the integration of operations and other factors, it is
not practicable to determine the earnings included in our consolidated statement of operations for the year ended
December 31, 2009 attributable to NextRx.