Express Scripts 2009 Annual Report Download - page 51
Download and view the complete annual report
Please find page 51 of the 2009 Express Scripts annual report below. You can navigate through the pages in the report by either clicking on the pages listed below, or by using the keyword search tool below to find specific information within the annual report.-
 1
1 -
2
-
3
-
4
-
5
-
6
-
7
-
8
-
9
-
10
-
11
-
12
-
13
-
14
-
15
-
16
-
17
-
18
-
19
-
20
-
21
-
22
-
23
-
24
-
25
-
26
-
27
-
28
-
29
-
30
-
31
-
32
-
33
-
34
-
35
-
36
-
37
-
38
-
39
-
40
-
 41
41 -
 42
42 -
 43
43 -
 44
44 -
 45
45 -
 46
46 -
 47
47 -
 48
48 -
 49
49 -
 50
50 -
 51
51 -
 52
52 -
 53
53 -
 54
54 -
 55
55 -
 56
56 -
 57
57 -
 58
58 -
 59
59 -
 60
60 -
 61
61 -
62
-
63
-
64
-
65
-
66
-
67
-
68
-
69
-
70
-
71
-
72
-
73
-
74
-
75
-
76
-
77
-
78
-
79
-
80
-
81
-
82
-
83
-
84
-
85
-
86
-
87
-
88
-
89
-
90
-
91
-
92
-
93
-
94
-
95
-
96
-
97
-
98
-
99
-
100
-
101
-
102
-
103
-
104
-
105
-
106
-
107
-
108
 |
 |

Express Scripts 2009 Annual Report
R
E
SU
LT
S
O
F
O
PERATI
ONS
W
e changed our reportable segments to PBM and EM during the first quarter of 2009 (see Note 14).
W
e
ma
int
a
i
n
a PBM segment,
c
onsisting of our domestic and
C
anadian PBM operation
s
,
and specialty p
h
armacy operation
s
,
and a
n
EM
s
egment, which consist
s
o
f distribution of pharmaceuticals and medical supplies to providers and clinics, distribution of
s
ample u
n
i
ts to physicians and verification of practitioner licensure, fertility services to providers and patients, an
d
h
ealthcare administration and implementation of consume
r
-
d
ir
ec
t
ed
h
e
alth
c
ar
e
so
l
u
ti
o
n
s
.
All
s
egment information and
d
i
sc
l
osu
r
es
ha
ve
bee
n r
ec
la
s
sified for all periods presented to reflect the new segment structure
.
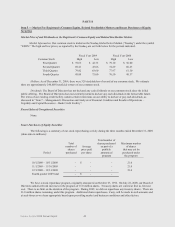
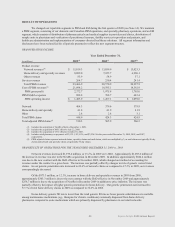
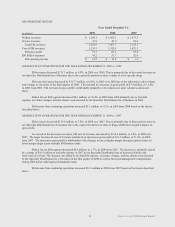
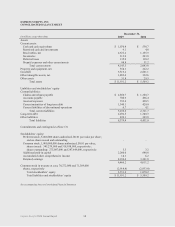
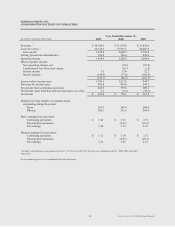
PBM
O
PERATI
NG
I
NCO
M
E
Year Ended December 31
,
(
in millions
)
20
0
9
(
1
)
20
0
8
(2
)
20
0
7
(
3
)
Pr
oduc
t r
eve
n
ue
N
e
t
wo
rk
reve
n
ues
(
4
)
$
1
5,
019.
3
$
13
,
039.
9
$
13
,
023.3
Home delivery and specialty revenues 8
,
0
9
9
.
0
7
,
225.
7
6
,
996.
1
O
ther revenue
s
8
3.
9
5
4.
9
37.1
S
ervice revenue
s
2
6
4
.
7
250
.4
241
.4
T
o
tal PBM r
eve
n
ues
23
,
466.
9
20
,
570.
9
20
,
297.
9
C
ost o
f
PBM revenue
s
(
4
)
2
1
,
0
9
4.
2
18
,
595.1 18
,
592.
9
PBM gross profit 2
,3
7
2
.
7
1
,
975.8 1
,
705.
0
PBM SG&A expense
s
888
.
8
708.
7
6
45
.4
PBM operating incom
e
$
1
,
48
3
.
9
$
1
,
267.
1
$
1
,
059.
6
N
e
t
wo
rk
4
04
.
3379.
6
379.
9
Home delivery and specialt
y
4
1
.
8
4
1.
9
4
1.
9
O
the
r
2
.
8
2
.
8 3
.
1
T
o
tal PBM
c
laim
s
4
4
8.
9
4
24
.3
4
24.
9
Total adjusted PBM claims
(
5
)
5
30
.
3
5
05.
9
5
06
.5
(
1
)
Includes the acquisition of NextRx effective December 1
,
200
9
.
(
2
)
Includes the acquisition of MSC effective July 22, 2008
.
(
3
)
In
c
l
udes
t
he acquisition of CYC effective October 10, 2007
.
(
4
)
In
c
l
udes
re
t
ail pharmacy co
-
payment
s
of
$
3
,
132.1
,
$
3
,
153.
6
,
an
d
$
3
,
554.5 for the years ended December 31, 20
0
9
,
20
0
8
,
and 20
0
7
,
r
espectively.
(
5
)
PBM adjusted clai
m
s represent network claims, specialt
y
c
laim
s
an
d
m
ail claims, which are multiplied by 3, as mail claims are typically 90 da
y
c
laim
s
an
d
n
e
t
wo
rk and specialt
y
c
laims are generally 30 day claims.
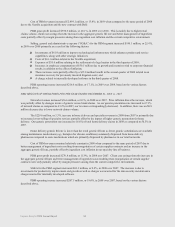
PBM
R
E
SU
LT
S
O
F
O
PERATI
ONS
F
O
R THE YEAR E
N
DED DECEMBER 31
,
200
9
vs
.
2
00
8
N
e
t
wo
rk r
eve
n
ues
i
ncreased $1
,
9
79.4
m
illion
,
o
r
15
.2
%
,
in 20
0
9
ove
r 20
0
8
.
A
pproximately $1,097.
6
m
illi
o
n
o
f
t
he increase in revenue was due to the NextRx acquisitio
n
i
n December 200
9
.
In addition, approximately $864
.4
m
illi
on
w
a
s
due
t
o
t
h
e
new
co
ntra
c
t
w
ith th
e
D
o
D
effe
c
tive in November 2009
,
w
hi
c
h
c
hanged our method of accounting fo
r
reve
n
ue
s
u
n
de
r th
e
co
ntra
c
t
t
o a gross basi
s
.
Th
e
in
c
r
e
a
se
was partially offset by changes in mi
x
o
f generic versus brand
c
laim
s
.
A
s our generic penetration rate increased to
6
9.
6
%
o
f
ne
twork claims as compared to
6
7.
3
%
in 20
0
8
,
our revenues
c
orrespondingl
y
dec
r
e
a
sed
.
O
f th
e
$
873.
3
m
illion
,
o
r
12
.
1%
,
increas
e
i
n home deliver
y
and specialt
y
reve
n
ues
i
n
2
00
9
f
r
o
m 20
0
8
,
approximatel
y
$
363.3 million is due to
t
h
e
new
co
ntra
c
t
w
ith th
e
D
oD
effective in November 200
9
an
d
approximatel
y
$
258.
7
m
illi
o
n i
s
due to the acquisition of NextRx in December 200
9
i
n addition to price inflation
.
Th
e
in
c
r
e
a
se
w
a
s
partiall
y
o
ffset b
y
t
h
e
i
mpact
o
f higher generic penetratio
n
for home deliver
y
.
O
u
r
g
eneric penetration rat
e
i
n
c
r
e
a
sed
to
5
7.
7
%
o
f
to
t
al home delivery claims in 20
0
9
as compared to
5
6.6
%
in 20
0
8
.
H
o
me delivery generic fill rate is lower than the retail generic fill rate as fewer generic substitutions are available
among maintenance m
e
dications (e.g
.
,
t
herapies for chronic conditions) commonly dispensed from home deliver
y
pharmacies co
m
pared to acute medications which ar
e
primarily dispensed by pharmacies in our retail networks
.
49