Express Scripts 2009 Annual Report Download - page 84
Download and view the complete annual report
Please find page 84 of the 2009 Express Scripts annual report below. You can navigate through the pages in the report by either clicking on the pages listed below, or by using the keyword search tool below to find specific information within the annual report.-
 1
1 -
2
-
3
-
4
-
5
-
6
-
7
-
8
-
9
-
10
-
11
-
12
-
13
-
14
-
15
-
16
-
17
-
18
-
19
-
20
-
21
-
22
-
23
-
24
-
25
-
26
-
27
-
28
-
29
-
30
-
31
-
32
-
33
-
34
-
35
-
36
-
37
-
38
-
39
-
40
-
41
-
42
-
43
-
44
-
45
-
46
-
47
-
48
-
49
-
50
-
51
-
52
-
53
-
54
-
55
-
56
-
57
-
58
-
59
-
60
-
61
-
62
-
63
-
64
-
65
-
66
-
67
-
68
-
69
-
70
-
71
-
72
-
73
-
 74
74 -
 75
75 -
 76
76 -
 77
77 -
 78
78 -
 79
79 -
 80
80 -
 81
81 -
 82
82 -
 83
83 -
 84
84 -
 85
85 -
 86
86 -
 87
87 -
 88
88 -
 89
89 -
 90
90 -
 91
91 -
 92
92 -
 93
93 -
 94
94 -
95
-
96
-
97
-
98
-
99
-
100
-
101
-
102
-
103
-
104
-
105
-
106
-
107
-
108
 |
 |

Express Scripts 2009 Annual Report
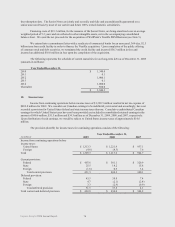
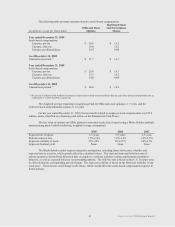
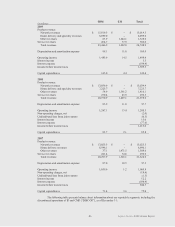
A summary of the status of stock options and SSRs as of December 31, 2009, and changes during the year
ended December 31, 2009 is presented below.
2009
(share data in millions)
Shares
Weighted-
Average
Exercise
Price
Outstanding at beginning of year
7.1
$ 37.96
Granted
2.4
46.46
Exercised
(1.1)
27.43
Forfeited/cancelled
(0.2)
49.57
Outstanding at end of period
8.2
41.54
Awards exercisable at period end
4.3
33.25
Weighted-average fair value of
options granted during the year
14.54
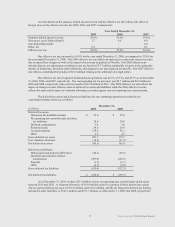
A summary of the status of restricted stock and performance shares as of December 31, 2009, and changes
during the year ended December 31, 2009 is presented below.
2009
(share data in millions)
Shares
Weighted-
Average
Grant
Date Fair
Value
Outstanding at beginning of year
0.5
$ 47.78
Granted
0.3
46.52
Other(1)
0.1
47.43
Released
(0.3)
46.09
Forfeited/Cancelled
-
-
Outstanding at end of period
0.6
(1) Represents additional performance shares issued above the original value for exceeding certain performance metrics.
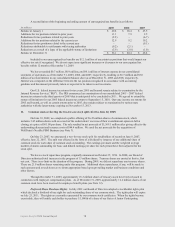
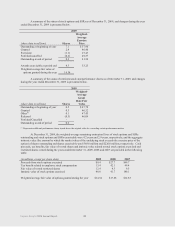
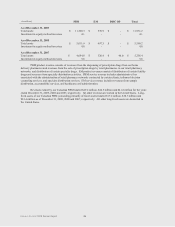
At December 31, 2009, the weighted-average remaining contractual lives of stock options and SSRs
outstanding and stock options and SSRs exercisable were 4.2 years and 2.9 years, respectively, and the aggregate
intrinsic value (the amount by which the market value of the underlying stock exceeds the exercise price of the
option) of shares outstanding and shares exercisable was $368.0 million and $226.0 million, respectively. Cash
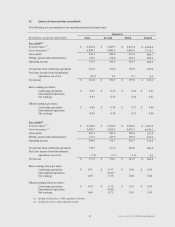
proceeds, tax benefits, fair value of vested shares and intrinsic value related to total stock options exercised and
restricted shares vested during the years ended December 31, 2009, 2008 and 2007 are provided in the following
table:
(in millions, except per share data)
2009
2008
2007
Proceeds from stock options exercised
$9.4
$27.7
$49.7
Tax benefit related to employee stock compensation
13.4
42.1
49.4
Fair value of vested restricted shares
12.4
4.3
9.3
Intrinsic value of stock options exercised
48.8
41.7
140.1
Weighted average fair value of options granted during the year
$14.54
$17.88
$12.83
82