Express Scripts 2009 Annual Report Download - page 53
Download and view the complete annual report
Please find page 53 of the 2009 Express Scripts annual report below. You can navigate through the pages in the report by either clicking on the pages listed below, or by using the keyword search tool below to find specific information within the annual report.-
 1
1 -
2
-
3
-
4
-
5
-
6
-
7
-
8
-
9
-
10
-
11
-
12
-
13
-
14
-
15
-
16
-
17
-
18
-
19
-
20
-
21
-
22
-
23
-
24
-
25
-
26
-
27
-
28
-
29
-
30
-
31
-
32
-
33
-
34
-
35
-
36
-
37
-
38
-
39
-
40
-
41
-
42
-
 43
43 -
 44
44 -
 45
45 -
 46
46 -
 47
47 -
 48
48 -
 49
49 -
 50
50 -
 51
51 -
 52
52 -
 53
53 -
 54
54 -
 55
55 -
 56
56 -
 57
57 -
 58
58 -
 59
59 -
 60
60 -
 61
61 -
 62
62 -
 63
63 -
64
-
65
-
66
-
67
-
68
-
69
-
70
-
71
-
72
-
73
-
74
-
75
-
76
-
77
-
78
-
79
-
80
-
81
-
82
-
83
-
84
-
85
-
86
-
87
-
88
-
89
-
90
-
91
-
92
-
93
-
94
-
95
-
96
-
97
-
98
-
99
-
100
-
101
-
102
-
103
-
104
-
105
-
106
-
107
-
108
 |
 |

Express Scripts 2009 Annual Report
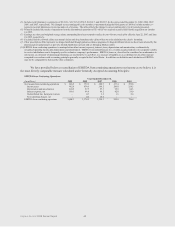
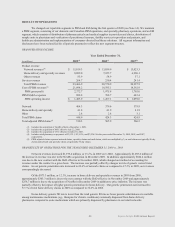
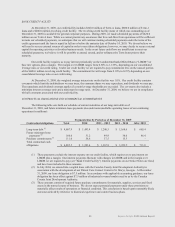
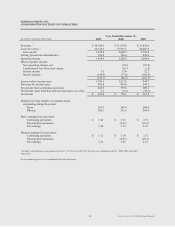
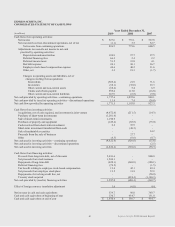
EM OPERATING INCOME
Year Ended December 31,
(in millions)
2009
2008
2007
Product revenues
$ 1,244.1
$ 1,361.2
$ 1,471.5
Service revenues
37.9
45.9
54.6
Total EM revenues
1,282.0
1,407.1
1,526.1
Cost of EM revenues
1,224.3
1,342.0
1,472.3
EM gross profit
57.7
65.1
53.8
EM SG&A expenses
43.2
51.7
52.6
EM operating income
$ 14.5
$ 13.4
$ 1.2
EM RESULTS OF OPERATIONS FOR THE YEAR ENDED DECEMBER 31, 2009 vs. 2008
EM revenues decreased $125.1 million, or 8.9%, in 2009 over 2008. This is primarily due to decreased revenues in
our Specialty Distribution line of business due to the expected reduction in sales volume of a few specific drugs.
EM cost of revenues decreased by $117.7 million, or 8.8%, in 2009 over 2008 due to the reduction in sales volume
and a charge to inventory in the third quarter of 2008. This resulted in a decrease in gross profit of $7.4 million, or 11.4%,
in 2009 from 2008. The decrease in gross profit is attributable primarily to the reduction in sales volume as discussed
above.
SG&A for our EM segment decreased $8.5 million, or 16.4%, in 2009 from 2008 primarily due to bad debt
expense, severance charges, and site closure costs incurred by the Specialty Distribution line of business in 2008.
EM income from continuing operations increased $1.1 million, or 8.2%, in 2009 from 2008 based on the factors
described above.
EM RESULTS OF OPERATIONS FOR THE YEAR ENDED DECEMBER 31, 2008 vs. 2007
EM revenues decreased $119.0 million, or 7.8%, in 2008 over 2007. This is primarily due to decreased revenues in
our Specialty Distribution line of business due to the expected reduction in sales of drugs which had a negative impact on
gross profit.
As a result of the decrease in revenue, EM cost of revenues decreased by $130.3 million, or 8.9%, in 2008 over
2007. The larger decrease in cost of revenues resulted in an increase in gross profit of $11.3 million, or 21.0%, in 2008
from 2007. The increase in gross profit is attributable to the changes in mix as higher margin therapies replaced sales of
lower margin drugs across multiple EM business units.
SG&A for our EM segment decreased $0.9 million, or 1.7%, in 2008 from 2007. The decrease is primarily caused
by a charge of $16.5 million to bad debt expense in 2007 in our Specialty Distribution line of business related to the
insolvency of a client. The decrease was offset by the bad debt expense, severance charges, and site closure costs incurred
by the Specialty Distribution line of business in the first quarter of 2008 as well as increased management compensation
during 2008 in line with improved financial results.
EM income from continuing operations increased $12.2 million in 2008 from 2007 based on the factors described
above.
51