Express Scripts 2009 Annual Report Download - page 87
Download and view the complete annual report
Please find page 87 of the 2009 Express Scripts annual report below. You can navigate through the pages in the report by either clicking on the pages listed below, or by using the keyword search tool below to find specific information within the annual report.-
 1
1 -
2
-
3
-
4
-
5
-
6
-
7
-
8
-
9
-
10
-
11
-
12
-
13
-
14
-
15
-
16
-
17
-
18
-
19
-
20
-
21
-
22
-
23
-
24
-
25
-
26
-
27
-
28
-
29
-
30
-
31
-
32
-
33
-
34
-
35
-
36
-
37
-
38
-
39
-
40
-
41
-
42
-
43
-
44
-
45
-
46
-
47
-
48
-
49
-
50
-
51
-
52
-
53
-
54
-
55
-
56
-
57
-
58
-
59
-
60
-
61
-
62
-
63
-
64
-
65
-
66
-
67
-
68
-
69
-
70
-
71
-
72
-
73
-
74
-
75
-
76
-
 77
77 -
 78
78 -
 79
79 -
 80
80 -
 81
81 -
 82
82 -
 83
83 -
 84
84 -
 85
85 -
 86
86 -
 87
87 -
 88
88 -
 89
89 -
 90
90 -
 91
91 -
 92
92 -
 93
93 -
 94
94 -
 95
95 -
 96
96 -
 97
97 -
98
-
99
-
100
-
101
-
102
-
103
-
104
-
105
-
106
-
107
-
108
 |
 |

Express Scripts 2009 Annual Report
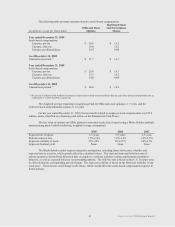
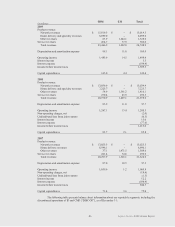
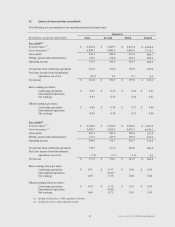
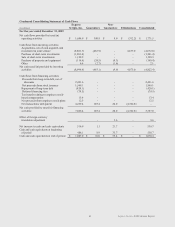
(in millions)
PBM
EM
Total
2009
Product revenue:
Network revenues
$ 15,019.3
$ -
$ 15,019.3
Home delivery and specialty revenues
8,099.0
-
8,099.0
Other revenues
83.9
1,244.1
1,328.0
Service revenues
264.7
37.9
302.6
Total revenues
23,466.9
1,282.0
24,748.9
Depreciation and amortization expense
98.1
11.8
109.9
Operating income
1,483.9
14.5
1,498.4
Interest income
5.3
Interest expense
(194.4)
Income before income taxes
1,309.3
Capital expenditures
145.0
4.4
149.4
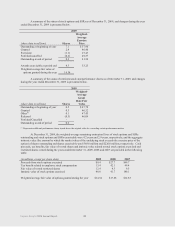
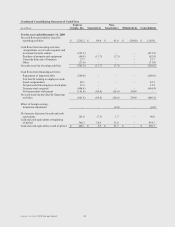
2008
Product revenue:
Network revenues
$ 13,039.9
$ -
$ 13,039.9
Home delivery and specialty revenues
7,225.7
-
7,225.7
Other revenues
54.9
1,361.2
1,416.1
Service revenues
250.4
45.9
296.3
Total revenues
20,570.9
1,407.1
21,978.0
Depreciation and amortization expense
85.9
11.8
97.7
Operating income
1,267.1
13.4
1,280.5
Non-operating charges, net
(2.0)
Undistributed loss from joint venture
(0.3)
Interest income
13.0
Interest expense
(77.6)
Income before income taxes
1,213.6
Capital expenditures
83.7
2.1
85.8
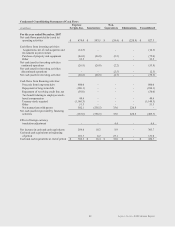
2007
Product revenue:
Network revenues
$ 13,023.3
$ -
$ 13,023.3
Home delivery revenues
6,996.1
-
6,996.1
Other revenues
37.1
1,471.5
1,508.6
Service revenues
241.4
54.6
296.0
Total revenues
20,297.9
1,526.1
21,824.0
Depreciation and amortization expense
87.0
10.5
97.5
Operating income
1,059.6
1.2
1,060.8
Non-operating charges, net
(18.6)
Undistributed loss from joint venture
(1.3)
Interest income
12.2
Interest expense
(108.4)
Income before income taxes
944.7
Capital expenditures
71.4
3.6
75.0
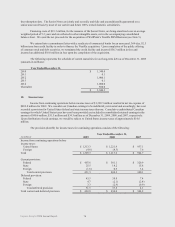
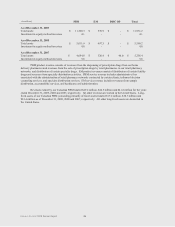
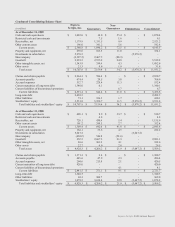
The following table presents balance sheet information about our reportable segments, including the
discontinued operations of IP and CMP (“DISC OP”), as of December 31:
85