Express Scripts 2009 Annual Report Download - page 70
Download and view the complete annual report
Please find page 70 of the 2009 Express Scripts annual report below. You can navigate through the pages in the report by either clicking on the pages listed below, or by using the keyword search tool below to find specific information within the annual report.-
 1
1 -
2
-
3
-
4
-
5
-
6
-
7
-
8
-
9
-
10
-
11
-
12
-
13
-
14
-
15
-
16
-
17
-
18
-
19
-
20
-
21
-
22
-
23
-
24
-
25
-
26
-
27
-
28
-
29
-
30
-
31
-
32
-
33
-
34
-
35
-
36
-
37
-
38
-
39
-
40
-
41
-
42
-
43
-
44
-
45
-
46
-
47
-
48
-
49
-
50
-
51
-
52
-
53
-
54
-
55
-
56
-
57
-
58
-
59
-
 60
60 -
 61
61 -
 62
62 -
 63
63 -
 64
64 -
 65
65 -
 66
66 -
 67
67 -
 68
68 -
 69
69 -
 70
70 -
 71
71 -
 72
72 -
 73
73 -
 74
74 -
 75
75 -
 76
76 -
 77
77 -
 78
78 -
 79
79 -
 80
80 -
81
-
82
-
83
-
84
-
85
-
86
-
87
-
88
-
89
-
90
-
91
-
92
-
93
-
94
-
95
-
96
-
97
-
98
-
99
-
100
-
101
-
102
-
103
-
104
-
105
-
106
-
107
-
108
 |
 |

Express Scripts 2009 Annual Report
Cost of revenues. Cost of revenues includes product costs, network pharmacy claims payments, co-
payments, and other direct costs associated with dispensing prescriptions, including shipping and handling (see also
“Revenue Recognition” and “Rebate Accounting”). We changed our accounting policy for member co-payments
during the third quarter of 2008 to include member co-payments to retail pharmacies in revenue and cost of revenue.
Income taxes. Deferred tax assets and liabilities are recognized based on temporary differences between
financial statement basis and tax basis of assets and liabilities using presently enacted tax rates. We account for
uncertainty in income taxes as described in Note 10.
Employee stock-based compensation. Grant-date fair value of stock options and “stock-settled” stock
appreciation rights (“SSRs”) are estimated using a Black-Scholes valuation model. Compensation expense is
reduced based on estimated forfeitures with adjustments recorded at the time of vesting when actual forfeitures are
greater than estimates. Forfeitures are estimated based on historical experience. We use an accelerated method of
recognizing compensation cost for awards with graded vesting, which essentially treats the grant as three separate
awards, with vesting periods of 12, 24 and 36 months for those grants that vest over three years. The majority of our
stock-based awards have three-year vesting.
See Note 12 for more information regarding stock-based compensation.
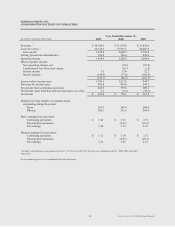
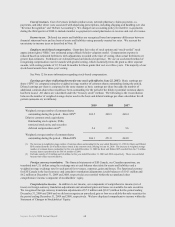
Earnings per share (reflecting the two-for-one stock split effective June 22, 2007). Basic earnings per
share (“EPS”) is computed using the weighted average number of common shares outstanding during the period.
Diluted earnings per share is computed in the same manner as basic earnings per share but adds the number of
additional common shares that would have been outstanding for the period if the dilutive potential common shares
had been issued. All shares are calculated under the “treasury stock” method. The following is the reconciliation
between the number of weighted average shares used in the basic and diluted earnings per share calculation for all
periods (amounts are in millions):
2009
2008
2007
Weighted average number of common shares
outstanding during the period – Basic EPS(1)
263.5
248.9
260.4
Dilutive common stock equivalents:
Outstanding stock options, SSRs,
restricted stock units, and executive
deferred compensation units(2)
2.6
2.9
3.6
Weighted average number of common shares
outstanding during the period – Diluted EPS
266.1
251.8
264.0
(1) The increase in weighted average number of common shares outstanding for the year ended December 31, 2009 for Basic and Diluted
EPS resulted from the 26.45 million shares issued in the common stock offering on June 10, 2009. The decrease in weighted average
number of common shares outstanding for the year ended December 31, 2008 for Basic and Diluted EPS resulted from the 7.2 million
treasury shares repurchased in the first six months of 2008.
(2) Excludes awards of 0.8 million and 0.4 million for the year ended December 31, 2009 and 2008, respectively. These were excluded
because their effect was anti-dilutive.
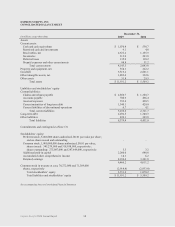
Foreign currency translation. The financial statements of ESI Canada, our Canadian operations, are
translated into U.S. dollars using the exchange rate at each balance sheet date for assets and liabilities and a
weighted average exchange rate for each period for revenues, expenses, gains and losses. The functional currency
for ESI Canada is the local currency and cumulative translation adjustments (credit balances of $14.1 million and
$6.2 million at December 31, 2009 and 2008, respectively) are recorded within the accumulated other
comprehensive income component of stockholders’ equity.
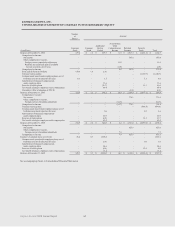
Comprehensive income. In addition to net income, our components of comprehensive income (net of
taxes) are foreign currency translation adjustments and unrealized gains and losses on available-for-sale securities.
We recognized foreign currency translation adjustments of $7.9 million and ($14.7) million for the period ending
December 31, 2009 and 2008 and we did not recognize an unrealized gain or loss on available-for-sale securities for
the period ending December 31, 2009 and 2008, respectively. We have displayed comprehensive income within the
Statement of Changes in Stockholders’ Equity.
68