Express Scripts 2009 Annual Report Download - page 89
Download and view the complete annual report
Please find page 89 of the 2009 Express Scripts annual report below. You can navigate through the pages in the report by either clicking on the pages listed below, or by using the keyword search tool below to find specific information within the annual report.-
 1
1 -
2
-
3
-
4
-
5
-
6
-
7
-
8
-
9
-
10
-
11
-
12
-
13
-
14
-
15
-
16
-
17
-
18
-
19
-
20
-
21
-
22
-
23
-
24
-
25
-
26
-
27
-
28
-
29
-
30
-
31
-
32
-
33
-
34
-
35
-
36
-
37
-
38
-
39
-
40
-
41
-
42
-
43
-
44
-
45
-
46
-
47
-
48
-
49
-
50
-
51
-
52
-
53
-
54
-
55
-
56
-
57
-
58
-
59
-
60
-
61
-
62
-
63
-
64
-
65
-
66
-
67
-
68
-
69
-
70
-
71
-
72
-
73
-
74
-
75
-
76
-
77
-
78
-
 79
79 -
 80
80 -
 81
81 -
 82
82 -
 83
83 -
 84
84 -
 85
85 -
 86
86 -
 87
87 -
 88
88 -
 89
89 -
 90
90 -
 91
91 -
 92
92 -
 93
93 -
 94
94 -
 95
95 -
 96
96 -
 97
97 -
 98
98 -
 99
99 -
100
-
101
-
102
-
103
-
104
-
105
-
106
-
107
-
108
 |
 |

Express Scripts 2009 Annual Report
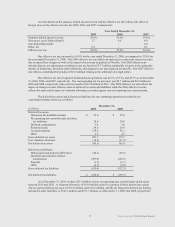
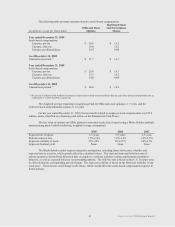
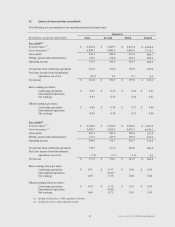
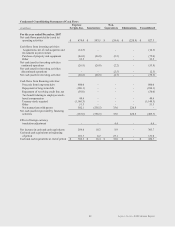
15. Quarterly financial data (unaudited)
The following is a presentation of our unaudited quarterly financial data:
Quarters
(in millions, except per share data)
First
Second
Third
Fourth
Fiscal 2009(1)
Total revenues (3)
$ 5,422.8
$ 5,503.3
$ 5,619.4
$ 8,203.4
Cost of revenues (3)
4,888.7
4,909.3
5,006.8
7,513.7
Gross profit
534.1
594.0
612.6
689.7
Selling, general and administrative
178.6
214.0
254.1
285.3
Operating income
355.5
380.0
358.5
404.4
Net income from continuing operations
214.7
192.0
196.9
222.9
Net (loss) income from discontinued
operations, net of tax
(0.3)
0.3
0.7
0.4
Net income
$ 214.4
$ 192.3
$ 197.6
$ 223.3
Basic earnings per share:
Continuing operations
$ 0.87
$ 0.75
$ 0.72
$ 0.81
Discontinued operations
-
-
-
-
Net earnings
0.87
0.75
0.72
0.81
Diluted earnings per share:
Continuing operations
$ 0.86
$ 0.74
$ 0.71
$ 0.80
Discontinued operations
-
-
-
-
Net earnings
0.86
0.74
0.71
0.80
Fiscal 2008(2)
Total revenues (3)
$ 5,490.8
$ 5,530.8
$ 5,450.5
$ 5,505.9
Cost of revenues (3)
5,024.7
5,028.2
4,930.1
4,954.1
Gross profit
466.1
502.6
520.4
551.8
Selling, general and administrative
171.5
185.9
189.7
213.3
Operating income
294.6
316.7
330.7
338.5
Net income from continuing operations
178.3
191.9
203.0
206.4
Net (loss) income from discontinued
operations, net of tax
(1.1)
(1.7)
(1.1)
0.4
Net income
$ 177.2
$ 190.2
$ 201.9
$ 206.8
Basic earnings (loss) per share:
Continuing operations
$ 0.71
$ 0.77
$ 0.82
$ 0.83
Discontinued operations
-
(0.01)
-
-
Net earnings
0.70
0.76
0.82
0.84
Diluted earnings (loss) per share:
Continuing operations
$ 0.70
$ 0.76
$ 0.81
$ 0.83
Discontinued operations
-
(0.01)
-
-
Net earnings
0.69
0.75
0.81
0.83
(1) Includes the December 1, 2009 acquisition of NextRx.
(2) Includes the July 22, 2008 acquisition of MSC.
87