Express Scripts 2009 Annual Report Download - page 63
Download and view the complete annual report
Please find page 63 of the 2009 Express Scripts annual report below. You can navigate through the pages in the report by either clicking on the pages listed below, or by using the keyword search tool below to find specific information within the annual report.-
 1
1 -
2
-
3
-
4
-
5
-
6
-
7
-
8
-
9
-
10
-
11
-
12
-
13
-
14
-
15
-
16
-
17
-
18
-
19
-
20
-
21
-
22
-
23
-
24
-
25
-
26
-
27
-
28
-
29
-
30
-
31
-
32
-
33
-
34
-
35
-
36
-
37
-
38
-
39
-
40
-
41
-
42
-
43
-
44
-
45
-
46
-
47
-
48
-
49
-
50
-
51
-
52
-
 53
53 -
 54
54 -
 55
55 -
 56
56 -
 57
57 -
 58
58 -
 59
59 -
 60
60 -
 61
61 -
 62
62 -
 63
63 -
 64
64 -
 65
65 -
 66
66 -
 67
67 -
 68
68 -
 69
69 -
 70
70 -
 71
71 -
 72
72 -
 73
73 -
74
-
75
-
76
-
77
-
78
-
79
-
80
-
81
-
82
-
83
-
84
-
85
-
86
-
87
-
88
-
89
-
90
-
91
-
92
-
93
-
94
-
95
-
96
-
97
-
98
-
99
-
100
-
101
-
102
-
103
-
104
-
105
-
106
-
107
-
108
 |
 |

Express Scripts 2009 Annual Report
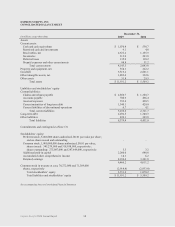
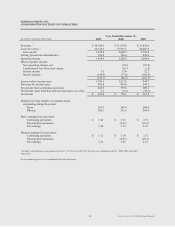
EXPRESS SCRIPTS, INC.
CONSOLIDATED STATEMENT OF CASH FLOWS
Year Ended December 31,
(in millions)
2009
2008
2007
Cash flows from operating activities:
Net income
$ 827.6
$ 776.1
$ 567.8
Net (income) loss from discontinued operations, net of tax
(1.1)
3.5
32.7
Net income from continuing operations
826.5
779.6
600.5
Adjustments to reconcile net income to net cash
provided by operating activities:
Depreciation and amortization
109.9
97.7
97.5
Deferred financing fees
66.3
2.4
2.2
Deferred income taxes
51.5
33.8
4.1
Bad debt expense
24.1
30.1
36.7
Employee stock-based compensation expense
44.6
40.2
31.6
Other, net
3.3
18.3
(1.7)
Changes in operating assets and liabilities, net of
changes resulting from acquisitions:
Receivables
(505.4)
21.9
71.6
Inventories
(58.1)
(38.0)
25.3
Other current and non-current assets
(68.4)
5.4
6.9
Claims and rebates payable
995.4
113.0
(16.8)
Other current and non-current liabilities
267.9
(8.8)
(9.8)
Net cash provided by operating activities—continuing operations
1,757.6
1,095.6
848.1
Net cash provided by (used in) operating activities—discontinued operations
13.9
7.4
(20.8)
Net cash flows provided by operating activities
1,771.5
1,103.0
827.3
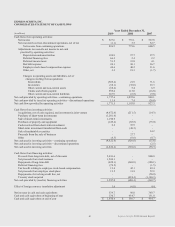
Cash flows from investing activities:
Acquisitions, net of cash acquired, and investment in joint venture
(4,672.6)
(251.5)
(14.3)
Purchase of short-term investments
(1,201.4)
-
-
Sale of short-term investments
1,198.9
-
-
Purchases of property and equipment
(149.4)
(85.8)
(75.0)
Cash received from short-term investment
6.4
38.9
-
Short-term investment transferred from cash
-
(49.3)
-
Sale of marketable securities
-
-
34.2
Proceeds from the sale of business
-
27.7
-
Other
(4.3)
(0.6)
(0.7)
Net cash used in investing activities—continuing operations
(4,822.4)
(320.6)
(55.8)
Net cash used in investing activities—discontinued operations
-
-
(2.5)
Net cash used in investing activities
(4,822.4)
(320.6)
(58.3)
Cash flows from financing activities:
Proceeds from long-term debt, net of discounts
2,491.6
-
800.0
Net proceeds from stock issuance
1,569.1
-
-
Repayment of long-term debt
(420.1)
(260.0)
(180.1)
Deferred financing fees
(79.5)
-
(1.5)
Tax benefit relating to employee stock-based compensation
13.4
42.1
49.4
Net proceeds from employee stock plans
12.5
31.9
52.8
Repayments of revolving credit line, net
-
-
(50.0)
Treasury stock acquired
-
(494.4)
(1,140.3)
Net cash provided by (used in) financing activities
3,587.0
(680.4)
(469.7)
Effect of foreign currency translation adjustment
3.6
(6.0)
4.4
Net increase in cash and cash equivalents
539.7
96.0
303.7
Cash and cash equivalents at beginning of year
530.7
434.7
131.0
Cash and cash equivalents at end of year
$ 1,070.4
$ 530.7
$ 434.7
61