Express Scripts 2009 Annual Report Download - page 52
Download and view the complete annual report
Please find page 52 of the 2009 Express Scripts annual report below. You can navigate through the pages in the report by either clicking on the pages listed below, or by using the keyword search tool below to find specific information within the annual report.-
 1
1 -
2
-
3
-
4
-
5
-
6
-
7
-
8
-
9
-
10
-
11
-
12
-
13
-
14
-
15
-
16
-
17
-
18
-
19
-
20
-
21
-
22
-
23
-
24
-
25
-
26
-
27
-
28
-
29
-
30
-
31
-
32
-
33
-
34
-
35
-
36
-
37
-
38
-
39
-
40
-
41
-
 42
42 -
 43
43 -
 44
44 -
 45
45 -
 46
46 -
 47
47 -
 48
48 -
 49
49 -
 50
50 -
 51
51 -
 52
52 -
 53
53 -
 54
54 -
 55
55 -
 56
56 -
 57
57 -
 58
58 -
 59
59 -
 60
60 -
 61
61 -
 62
62 -
63
-
64
-
65
-
66
-
67
-
68
-
69
-
70
-
71
-
72
-
73
-
74
-
75
-
76
-
77
-
78
-
79
-
80
-
81
-
82
-
83
-
84
-
85
-
86
-
87
-
88
-
89
-
90
-
91
-
92
-
93
-
94
-
95
-
96
-
97
-
98
-
99
-
100
-
101
-
102
-
103
-
104
-
105
-
106
-
107
-
108
 |
 |

Express Scripts 2009 Annual Report 50
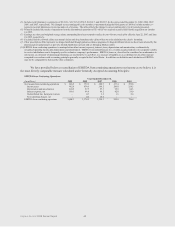
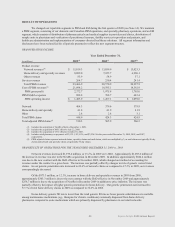
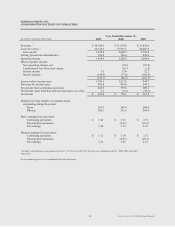
C
ost o
f
PBM
reve
n
ues
i
ncreased $2
,
4
99.1
m
illion
,
or 13.
4
%
,
in
2
00
9
when compared to the same period of 2
00
8
due
t
o
th
e
N
e
xtRx acquisition and
t
h
e
new
co
ntra
c
t
w
ith D
o
D
.
PBM gross profit increased $396.
9
m
illion
,
o
r
20
.
1%
,
in 20
0
9
ove
r 20
0
8
.
This is mainly due to highe
r
re
tail
c
laims volume
,
c
l
ient cost saving
s
f
r
o
m
th
e
i
ncrease in the aggregate generic fill rate and better mana
g
ement of ingredient
c
osts partially offset by margin pressures arising fro
m
i
ngredient cost inflation and
t
he current competitive environment.
Selling, general and admini
s
t
rative exp
e
n
se
(
“SG&A”
)
for th
e
PBM segment increased $180
.
1
m
illion
,
o
r
25
.4
%
,
i
n 2
00
9
ove
r
2
00
8
primarily as a result of the following factors
:
I
nvestments of $61.
9
m
illion to improve technological infrastructure which enhances product and service
c
apabilities, along with other strategic initiatives;
C
osts of $61.1 million related to the NextRx acquisition;
Expenses of $35.0 million relating to the settlement of a l
e
g
al matter in the
t
hir
d
quarter o
f
2009;
I
n
c
r
e
a
ses
i
n
employee compensation of $30.
5
m
illion due to growth and incentives tied to corporate financial
r
esults
,
in addition to the effect of inflation
;
These increases were partially offset by a $15.0 millio
n
be
n
e
fit
i
n the second quarter of 2009
re
lat
ed
t
o
an
i
nsurance recovery for previously incurred litigation costs; and
A
charge related to internally developed software in the third quarter of 2008
.
PBM
o
perating inco
m
e increased $216
.
8
m
illion
,
o
r
17.1%
,
i
n
2
00
9
ove
r 20
0
8
,
based on the various factors
desc
ri
bed
a
bove.
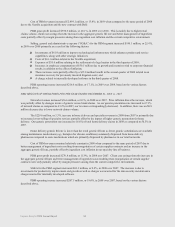
PBM
R
E
SU
LT
S
O
F
O
PERATI
ONS
F
O
R
T
HE YEAR ENDED DECEMBER 31
,
200
8
vs
.
2
00
7
Network revenues increased $16.6 million
,
or 0.1%
,
in 2008 over 2007. Price inflation drove the increase
,
which
was partially offset by changes in mix of generic versus brand claims. As our generic penetration rate increased to 67.3%
o
f n
e
t
wo
rk
c
laim
s
a
s
c
ompared to 63.2% in 2007, our revenues correspondingly decreased. In addition, there was an $8.9
m
illi
o
n
dec
r
e
a
se
due
t
o
l
owe
r n
e
t
wo
rk
c
laim
s
vo
l
u
m
e.
The $229.6 million, or 3.3%, increase in home delivery and specialty revenues in 2008 from 2007 is pri
m
arily due
to
in
c
r
e
a
sed
c
r
oss
-
s
elling of specialty services partially offset by the impact of higher generic penetration for home
delivery. Our generic penetration rate increased to 56.6% of total home delivery claims in 2008 as compared to 50.5% i
n
2007
.
Home delivery generic fill rate is lower than the retail generic fill rate as fewer generic substitutions are available
among maintenance medications (e.g., therapies for chronic conditions) commonly dispensed from home deliver
y
pharmacies compared to acute medications which are primarily dispensed by pharmacies in our retail networks
.
C
ost of PBM revenues remained relatively constant in 2008 when compared to the same period of 2007 due to
b
etter management of ingredient costs resulting from renegotiat
io
n
of certain supplier contracts and a
n
i
n
c
r
e
a
se
i
n
t
h
e
aggregate generic fill rate, partially offset by ingredient cost inflation in our specialty line of business
.
PBM gross profit increased $270.8 million, or 15.9%, in 2008 over 2007. Client cost savings from the increase i
n
t
he aggregate generic fill rate and better management of ingredient costs resulting from renegotiation of certain supplie
r
c
ontracts were onl
y
partially offset by margin pressures arising from the current competitive environment.
SG&A
for the PBM segment increased $63.3 million, or 9.8%, in 2008 over 2007. The increase is due to
i
nvestments for productivity improvement and growth as well as
c
harges we incurred for the data security incident and a
c
harge incurred for internally developed software
.
PBM operating income increased $207.5 million, or 19.6%, in 2008 over 2007, based on the various factors
desc
ri
bed
a
bove.