Express Scripts 2009 Annual Report Download - page 88
Download and view the complete annual report
Please find page 88 of the 2009 Express Scripts annual report below. You can navigate through the pages in the report by either clicking on the pages listed below, or by using the keyword search tool below to find specific information within the annual report.-
 1
1 -
2
-
3
-
4
-
5
-
6
-
7
-
8
-
9
-
10
-
11
-
12
-
13
-
14
-
15
-
16
-
17
-
18
-
19
-
20
-
21
-
22
-
23
-
24
-
25
-
26
-
27
-
28
-
29
-
30
-
31
-
32
-
33
-
34
-
35
-
36
-
37
-
38
-
39
-
40
-
41
-
42
-
43
-
44
-
45
-
46
-
47
-
48
-
49
-
50
-
51
-
52
-
53
-
54
-
55
-
56
-
57
-
58
-
59
-
60
-
61
-
62
-
63
-
64
-
65
-
66
-
67
-
68
-
69
-
70
-
71
-
72
-
73
-
74
-
75
-
76
-
77
-
 78
78 -
 79
79 -
 80
80 -
 81
81 -
 82
82 -
 83
83 -
 84
84 -
 85
85 -
 86
86 -
 87
87 -
 88
88 -
 89
89 -
 90
90 -
 91
91 -
 92
92 -
 93
93 -
 94
94 -
 95
95 -
 96
96 -
 97
97 -
 98
98 -
99
-
100
-
101
-
102
-
103
-
104
-
105
-
106
-
107
-
108
 |
 |

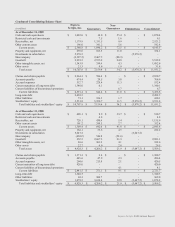
Express Scripts 2009 Annual Report
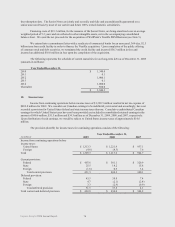
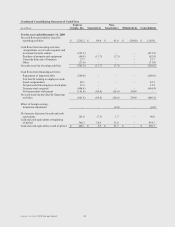
(in millions)
PBM
EM
DISC OP
Total
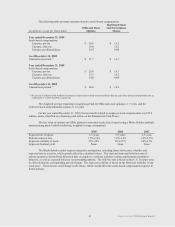
As of December 31, 2009
Total assets
$ 11,560.3
$ 370.9
$ -
$ 11,931.2
Investment in equity method investees
4.1
-
-
4.1
As of December 31, 2008
Total assets
$ 5,011.9
$ 497.3
$ -
$ 5,509.2
Investment in equity method investees
4.0
-
-
4.0
As of December 31, 2007
Total assets
$ 4,684.0
$ 526.4
$ 46.0
$ 5,256.4
Investment in equity method investees
3.6
-
-
3.6
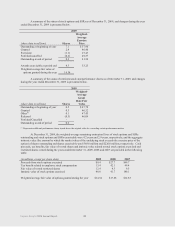
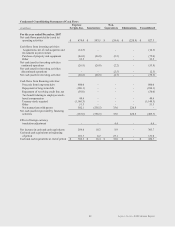
PBM product revenue consists of revenues from the dispensing of prescription drugs from our home
delivery pharmacies and revenues from the sale of prescription drugs by retail pharmacies in our retail pharmacy
networks, and distribution of certain specialty drugs. EM product revenues consist of distribution of certain fertility
drugs and revenues from specialty distribution activities. PBM service revenue includes administrative fees
associated with the administration of retail pharmacy networks contracted by certain clients, informed decision
counseling services, and specialty distribution services. EM service revenue includes revenues from sample
distribution, accountability services, and healthcare card administration.
Revenues earned by our Canadian PBM totaled $49.2 million, $44.5 million and $41.8 million for the years
ended December 31, 2009, 2008 and 2007, respectively. All other revenues are earned in the United States. Long-
lived assets of our Canadian PBM (consisting primarily of fixed assets) totaled $15.2 million, $10.7 million and
$23.4 million as of December 31, 2009, 2008 and 2007, respectively. All other long-lived assets are domiciled in
the United States.
86