Express Scripts 2009 Annual Report Download - page 2
Download and view the complete annual report
Please find page 2 of the 2009 Express Scripts annual report below. You can navigate through the pages in the report by either clicking on the pages listed below, or by using the keyword search tool below to find specific information within the annual report.-
 1
1 -
 2
2 -
 3
3 -
 4
4 -
 5
5 -
 6
6 -
 7
7 -
 8
8 -
 9
9 -
 10
10 -
 11
11 -
 12
12 -
 13
13 -
14
-
15
-
16
-
17
-
18
-
19
-
20
-
21
-
22
-
23
-
24
-
25
-
26
-
27
-
28
-
29
-
30
-
31
-
32
-
33
-
34
-
35
-
36
-
37
-
38
-
39
-
40
-
41
-
42
-
43
-
44
-
45
-
46
-
47
-
48
-
49
-
50
-
51
-
52
-
53
-
54
-
55
-
56
-
57
-
58
-
59
-
60
-
61
-
62
-
63
-
64
-
65
-
66
-
67
-
68
-
69
-
70
-
71
-
72
-
73
-
74
-
75
-
76
-
77
-
78
-
79
-
80
-
81
-
82
-
83
-
84
-
85
-
86
-
87
-
88
-
89
-
90
-
91
-
92
-
93
-
94
-
95
-
96
-
97
-
98
-
99
-
100
-
101
-
102
-
103
-
104
-
105
-
106
-
107
-
108
 |
 |

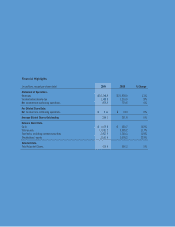
Financial Highlights
(in millions, except per share data) 2009 2008 % Change
Statement of Operations:
Revenues $ 24,748.9 $ 21,978.0 13%
Income before income tax 1,309.3 1,213.6 8%
Net income from continuing operations 826.5 779.6 6%
Per Diluted Share Data:
Net income from continuing operations $ 3.11 $ 3.10 0%
Average Diluted Shares Outstanding 266.1 251.8 6%
Balance Sheet Data:
Cash $ 1,070.4 $ 530.7 102%
Total assets 11,931.2 5,509.2 117%
Total debt, including current maturities 3,832.6 1,760.3 118%
Stockholders’ equity 3,551.8 1,078.2 229%
Selected Data:
Total Adjusted Claims 530.6 506.3 5%