Express Scripts 2009 Annual Report Download - page 61
Download and view the complete annual report
Please find page 61 of the 2009 Express Scripts annual report below. You can navigate through the pages in the report by either clicking on the pages listed below, or by using the keyword search tool below to find specific information within the annual report.-
 1
1 -
2
-
3
-
4
-
5
-
6
-
7
-
8
-
9
-
10
-
11
-
12
-
13
-
14
-
15
-
16
-
17
-
18
-
19
-
20
-
21
-
22
-
23
-
24
-
25
-
26
-
27
-
28
-
29
-
30
-
31
-
32
-
33
-
34
-
35
-
36
-
37
-
38
-
39
-
40
-
41
-
42
-
43
-
44
-
45
-
46
-
47
-
48
-
49
-
50
-
 51
51 -
 52
52 -
 53
53 -
 54
54 -
 55
55 -
 56
56 -
 57
57 -
 58
58 -
 59
59 -
 60
60 -
 61
61 -
 62
62 -
 63
63 -
 64
64 -
 65
65 -
 66
66 -
 67
67 -
 68
68 -
 69
69 -
 70
70 -
 71
71 -
72
-
73
-
74
-
75
-
76
-
77
-
78
-
79
-
80
-
81
-
82
-
83
-
84
-
85
-
86
-
87
-
88
-
89
-
90
-
91
-
92
-
93
-
94
-
95
-
96
-
97
-
98
-
99
-
100
-
101
-
102
-
103
-
104
-
105
-
106
-
107
-
108
 |
 |

Express Scripts 2009 Annual Report
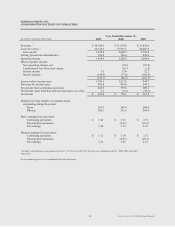
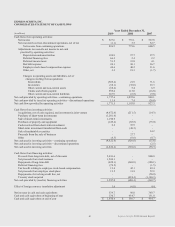
EXPRESS SCRIPTS, INC.
CONSOLIDATED STATEMENT OF OPERATIONS
Year Ended December 31,
(in millions, except per share data)
2009
2008
2007
Revenues 1
$ 24,748.9
$ 21,978.0
$ 21,824.0
Cost of revenues 1
22,318.5
19,937.1
20,065.2
Gross profit
2,430.4
2,040.9
1,758.8
Selling, general and administrative
932.0
760.4
698.0
Operating income
1,498.4
1,280.5
1,060.8
Other (expense) income:
Non-operating charges, net
-
(2.0)
(18.6)
Undistributed loss from joint venture
-
(0.3)
(1.3)
Interest income
5.3
13.0
12.2
Interest expense
(194.4)
(77.6)
(108.4)
(189.1)
(66.9)
(116.1)
Income before income taxes
1,309.3
1,213.6
944.7
Provision for income taxes
482.8
434.0
344.2
Net income from continuing operations
826.5
779.6
600.5
Net income (loss) from discontinued operations, net of tax
1.1
(3.5)
(32.7)
Net income
$ 827.6
$ 776.1
$ 567.8
Weighted average number of common shares
outstanding during the period:
Basic:
263.5
248.9
260.4
Diluted:
266.1
251.8
264.0
Basic earnings (loss) per share:
Continuing operations
$ 3.14
$ 3.13
$ 2.31
Discontinued operations
-
(0.01)
(0.13)
Net earnings
3.14
3.12
2.18
Diluted earnings (loss) per share:
Continuing operations
$ 3.11
$ 3.10
$ 2.27
Discontinued operations
-
(0.01)
(0.12)
Net earnings
3.11
3.08
2.15
1 Includes retail pharmacy co-payments of $3,132.1, $3,153.6, and $3,554.5 for the years ended December 31, 2009, 2008, and 2007,
respectively.
See accompanying Notes to Consolidated Financial Statements
59