Delta Airlines 2013 Annual Report Download - page 98
Download and view the complete annual report
Please find page 98 of the 2013 Delta Airlines annual report below. You can navigate through the pages in the report by either clicking on the pages listed below, or by using the keyword search tool below to find specific information within the annual report.-
 1
1 -
2
-
3
-
4
-
5
-
6
-
7
-
8
-
9
-
10
-
11
-
12
-
13
-
14
-
15
-
16
-
17
-
18
-
19
-
20
-
21
-
22
-
23
-
24
-
25
-
26
-
27
-
28
-
29
-
30
-
31
-
32
-
33
-
34
-
35
-
36
-
37
-
38
-
39
-
40
-
41
-
42
-
43
-
44
-
45
-
46
-
47
-
48
-
49
-
50
-
51
-
52
-
53
-
54
-
55
-
56
-
57
-
58
-
59
-
60
-
61
-
62
-
63
-
64
-
65
-
66
-
67
-
68
-
69
-
70
-
71
-
72
-
73
-
74
-
75
-
76
-
77
-
78
-
79
-
80
-
81
-
82
-
83
-
84
-
85
-
86
-
87
-
 88
88 -
 89
89 -
 90
90 -
 91
91 -
 92
92 -
 93
93 -
 94
94 -
 95
95 -
 96
96 -
 97
97 -
 98
98 -
 99
99 -
 100
100 -
 101
101 -
 102
102 -
 103
103 -
 104
104 -
 105
105 -
 106
106 -
 107
107 -
 108
108 -
109
-
110
-
111
-
112
-
113
-
114
-
115
-
116
-
117
-
118
-
119
-
120
-
121
-
122
-
123
-
124
-
125
-
126
-
127
-
128
-
129
-
130
-
131
-
132
-
133
-
134
-
135
-
136
-
137
-
138
-
139
-
140
-
141
-
142
-
143
-
144
-
145
-
146
-
147
-
148
-
149
-
150
-
151
 |
 |

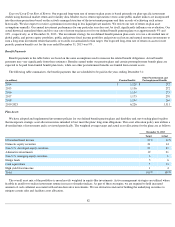
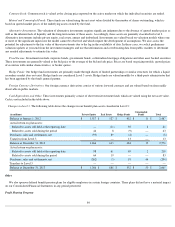
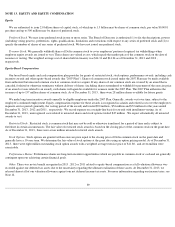
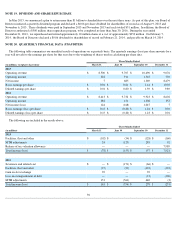
NOTE 14 . ACCUMULATED OTHER COMPREHENSIVE INCOME (LOSS)
The following table shows the components of accumulated other comprehensive income (loss):
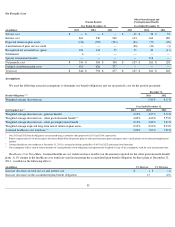
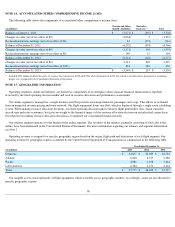
NOTE 15 . GEOGRAPHIC INFORMATION
Operating segments, airline and refinery, are defined as components of an enterprise whose separate financial information is regularly
reviewed by the chief operating decision maker and used in resource allocation and performance assessments.
Our airline segment is managed as a single business unit that provides air transportation for passengers and cargo. This allows us to benefit
from an integrated revenue pricing and route network. Our flight equipment forms one fleet, which is deployed through a single route scheduling
system. When making resource allocation decisions, our chief operating decision maker evaluates flight profitability data, which considers
aircraft type and route economics, but gives no weight to the financial impact of the resource allocation decision on an individual carrier basis.
Our objective in making resource allocation decisions is to optimize our consolidated financial results.
Our refinery segment operates for the benefit of the airline segment. The revenues of the refinery, primarily consisting of fuel sales to the
airline, have been eliminated in the Consolidated Financial Statements. For more information regarding our refinery and segment information,
see Note 2 .
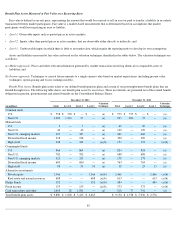
Operating revenue is assigned to a specific geographic region based on the origin, flight path and destination of each flight segment. Our
operating revenue by geographic region (as defined by the United States Department of Transportation) is summarized in the following table:
Our tangible assets consist primarily of flight equipment, which is mobile across geographic markets. Accordingly, assets are not allocated to
specific geographic regions.
90
(in millions) Pension and Other
Benefits Liabilities
Derivative
Contracts
(1)
Total
Balance at January 1, 2011
$
(3,271
)
$
(307
)
$
(3,578
)
Changes in value (net of tax effect of $0)
(3,062
)
5
(3,057
)
Reclassification into earnings (net of tax effect of $0)
41
(172
)
(131
)
Balance at December 31, 2011
(6,292
)
(474
)
(6,766
)
Changes in value (net of tax effect of $0)
(2,171
)
196
(1,975
)
Reclassification into earnings (net of tax effect of $0)
149
15
164
Balance at December 31, 2012
(8,314
)
(263
)
(8,577
)
Changes in value (net of tax effect of $0)
2,741
296
3,037
Reclassification into earnings (net of tax effect of $321)
224
186
410
Balance at December 31, 2013
$
(5,349
)
$
219
$
(5,130
)
(1)
Included $321 million of deferred income tax expense that remained in AOCI until 2013 when all amounts in AOCI that related to fuel derivatives designated as accounting
hedges were recognized in the Consolidated Statement of Operations.
Year Ended December 31,
(in millions) 2013 2012 2011
Domestic
$
24,857
$
23,989
$
22,722
Atlantic
6,446
6,329
6,486
Pacific
4,086
4,198
3,644
Latin America
2,384
2,154
2,263
Total
$
37,773
$
36,670
$
35,115