Delta Airlines 2013 Annual Report Download - page 88
Download and view the complete annual report
Please find page 88 of the 2013 Delta Airlines annual report below. You can navigate through the pages in the report by either clicking on the pages listed below, or by using the keyword search tool below to find specific information within the annual report.-
 1
1 -
2
-
3
-
4
-
5
-
6
-
7
-
8
-
9
-
10
-
11
-
12
-
13
-
14
-
15
-
16
-
17
-
18
-
19
-
20
-
21
-
22
-
23
-
24
-
25
-
26
-
27
-
28
-
29
-
30
-
31
-
32
-
33
-
34
-
35
-
36
-
37
-
38
-
39
-
40
-
41
-
42
-
43
-
44
-
45
-
46
-
47
-
48
-
49
-
50
-
51
-
52
-
53
-
54
-
55
-
56
-
57
-
58
-
59
-
60
-
61
-
62
-
63
-
64
-
65
-
66
-
67
-
68
-
69
-
70
-
71
-
72
-
73
-
74
-
75
-
76
-
77
-
 78
78 -
 79
79 -
 80
80 -
 81
81 -
 82
82 -
 83
83 -
 84
84 -
 85
85 -
 86
86 -
 87
87 -
 88
88 -
 89
89 -
 90
90 -
 91
91 -
 92
92 -
 93
93 -
 94
94 -
 95
95 -
 96
96 -
 97
97 -
 98
98 -
99
-
100
-
101
-
102
-
103
-
104
-
105
-
106
-
107
-
108
-
109
-
110
-
111
-
112
-
113
-
114
-
115
-
116
-
117
-
118
-
119
-
120
-
121
-
122
-
123
-
124
-
125
-
126
-
127
-
128
-
129
-
130
-
131
-
132
-
133
-
134
-
135
-
136
-
137
-
138
-
139
-
140
-
141
-
142
-
143
-
144
-
145
-
146
-
147
-
148
-
149
-
150
-
151
 |
 |

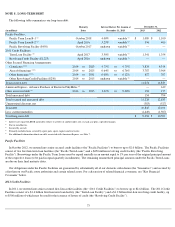
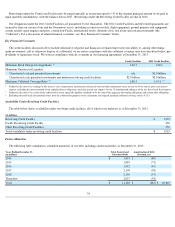
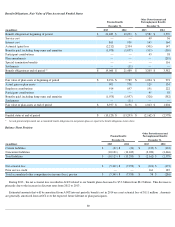
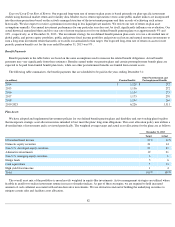
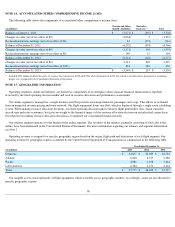
Benefit Obligations, Fair Value of Plan Assets and Funded Status
Balance Sheet Position
During 2013 , the net actuarial loss recorded in AOCI related to our benefit plans decreased to $5.3 billion from $8.2 billion
. This decrease is
primarily due to the increase in discount rates from 2012 to 2013 .
Estimated amounts that will be amortized from AOCI into net periodic benefit cost in 2014 are a net actuarial loss of $111 million . Amounts
are generally amortized from AOCI over the expected future lifetime of plan participants.
80
Pension Benefits
Other Postretirement and
Postemployment Benefits
December 31,
December 31,
(in millions) 2013 2012
2013 2012
Benefit obligation at beginning of period
$
21,489
$
19,293
$
3,582
$
3,570
Service cost
—
—
49
56
Interest cost
861
930
143
164
Actuarial (gain) loss
(2,212
)
2,334
(301
)
147
Benefits paid, including lump sums and annuities
(1,078
)
(1,057
)
(313
)
(310
)
Participant contributions
—
—
45
58
Plan amendments
—
—
—
(
219
)
Special termination benefits
—
—
—
116
Settlements
—
(
11
)
—
—
Benefit obligation at end of period
(1)
$
19,060
$
21,489
$
3,205
$
3,582
Fair value of plan assets at beginning of period
$
8,196
$
7,789
$
1,004
$
972
Actual gain on plan assets
905
778
129
134
Employer contributions
914
697
191
222
Participant contributions
—
—
45
58
Benefits paid, including lump sums and annuities
(1,078
)
(1,057
)
(326
)
(382
)
Settlements
—
(
11
)
—
—
Fair value of plan assets at end of period
$
8,937
$
8,196
$
1,043
$
1,004
Funded status at end of period
$
(10,123
)
$
(13,293
)
$
(2,162
)
$
(2,578
)
(1)
At each period-
end presented, our accumulated benefit obligations for our pension plans are equal to the benefit obligations shown above.
Pension Benefits Other Postretirement and
Postemployment Benefits
December 31, December 31,
(in millions) 2013 2012 2013 2012
Current liabilities
$
(22
)
$
(24
)
$
(139
)
$
(132
)
Noncurrent liabilities
(10,101
)
(13,269
)
(2,023
)
(2,446
)
Total liabilities
$
(10,123
)
$
(13,293
)
$
(2,162
)
$
(2,578
)
Net actuarial loss
$
(5,349
)
$
(7,958
)
$
(103
)
$
(473
)
Prior service credit
—
—
161
187
Total accumulated other comprehensive income (loss), pre-tax
$
(5,349
)
$
(7,958
)
$
58
$
(286
)