Delta Airlines 2013 Annual Report Download - page 94
Download and view the complete annual report
Please find page 94 of the 2013 Delta Airlines annual report below. You can navigate through the pages in the report by either clicking on the pages listed below, or by using the keyword search tool below to find specific information within the annual report.-
 1
1 -
2
-
3
-
4
-
5
-
6
-
7
-
8
-
9
-
10
-
11
-
12
-
13
-
14
-
15
-
16
-
17
-
18
-
19
-
20
-
21
-
22
-
23
-
24
-
25
-
26
-
27
-
28
-
29
-
30
-
31
-
32
-
33
-
34
-
35
-
36
-
37
-
38
-
39
-
40
-
41
-
42
-
43
-
44
-
45
-
46
-
47
-
48
-
49
-
50
-
51
-
52
-
53
-
54
-
55
-
56
-
57
-
58
-
59
-
60
-
61
-
62
-
63
-
64
-
65
-
66
-
67
-
68
-
69
-
70
-
71
-
72
-
73
-
74
-
75
-
76
-
77
-
78
-
79
-
80
-
81
-
82
-
83
-
 84
84 -
 85
85 -
 86
86 -
 87
87 -
 88
88 -
 89
89 -
 90
90 -
 91
91 -
 92
92 -
 93
93 -
 94
94 -
 95
95 -
 96
96 -
 97
97 -
 98
98 -
 99
99 -
 100
100 -
 101
101 -
 102
102 -
 103
103 -
 104
104 -
105
-
106
-
107
-
108
-
109
-
110
-
111
-
112
-
113
-
114
-
115
-
116
-
117
-
118
-
119
-
120
-
121
-
122
-
123
-
124
-
125
-
126
-
127
-
128
-
129
-
130
-
131
-
132
-
133
-
134
-
135
-
136
-
137
-
138
-
139
-
140
-
141
-
142
-
143
-
144
-
145
-
146
-
147
-
148
-
149
-
150
-
151
 |
 |

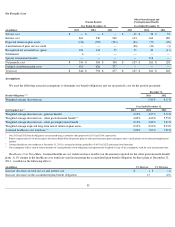
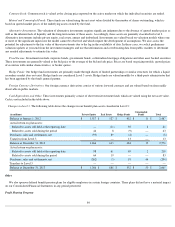
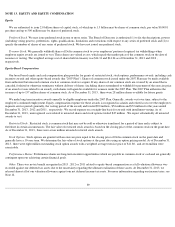
NOTE 12 . INCOME TAXES
Income Tax Benefit (Provision)
Our income tax benefit (provision) consisted of the following:
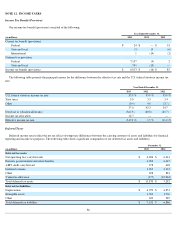
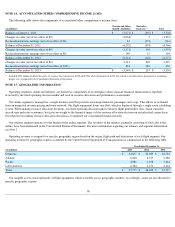
The following table presents the principal reasons for the difference between the effective tax rate and the U.S. federal statutory income tax
rate:
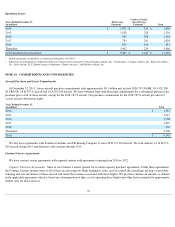
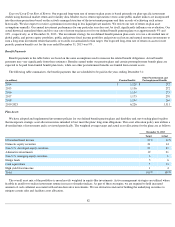
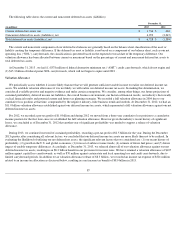
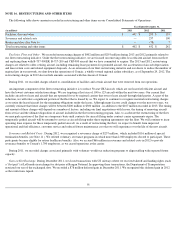
Deferred Taxes
Deferred income taxes reflect the net tax effect of temporary differences between the carrying amounts of assets and liabilities for financial
reporting and income tax purposes. The following table shows significant components of our deferred tax assets and liabilities:
86
Year Ended December 31,
(in millions) 2013 2012 2011
Current tax benefit (provision):
Federal
$
24
$
—
$
91
State and local
(3
)
15
(6
)
International
1
(14
)
(2
)
Deferred tax provision:
Federal
7,197
(4
)
2
State and local
794
(13
)
—
Income tax benefit (provision)
$
8,013
$
(16
)
$
85
Year Ended December 31,
2013 2012 2011
U.S. federal statutory income tax rate
35.0
%
35.0
%
35.0
%
State taxes
3.0
3.3
3.4
Other
(0.4
)
4.0
(3.7
)
37.6
42.3
34.7
Decrease in valuation allowance
(367.5
)
(40.8
)
(45.7
)
Income tax allocation
12.7
—
—
Effective income tax rate
(317.2
)%
1.5
%
(11.0
)%
December 31,
(in millions) 2013 2012
Deferred tax assets:
Net operating loss carryforwards
$
6,024
$
6,414
Pension, postretirement and other benefits
4,982
6,415
AMT credit carryforward
378
402
Deferred revenue
1,965
2,133
Other
698
881
Valuation allowance
(177
)
(10,963
)
Total deferred tax assets
$
13,870
$
5,282
Deferred tax liabilities:
Depreciation
$
4,799
$
4,851
Intangible assets
1,704
1,730
Other
639
285
Total deferred tax liabilities
$
7,142
$
6,866